Chainlink, Cosmos, Zcash Price Analysis: 07 February

LINK moved within a descending channel and the direction of a potential breakout was not clear at the time of writing. ATOM projected more upside moving forward as the indicators flashed bullish signals while ZEC moved within a fixed channel and awaited further cues from the broader market.
Chainlink [LINK]

Chainlink lost the $25.6 support as selling pressure mounted on the cryptocurrency over the past couple of days. The 24-hour trading volumes also contracted by nearly 30% as the figure fell to $2.8 billion.
On the 4-hour timeframe, LINK moved within a descending channel since its fall from record levels. The direction of the breakout was not clear at the moment, as the indicators flashed mixed signals for the world’s ninth-largest cryptocurrency. The Stochastic RSI was on the verge of a bullish crossover in the oversold zone but the Awesome Oscillator favored the bearish side.
Buy signals would be present if the candlesticks close above the upper trendline over the next few sessions. Conversely, a fall below the lower trendline could see an extended sell-off for LINK.
Cosmos [ATOM]
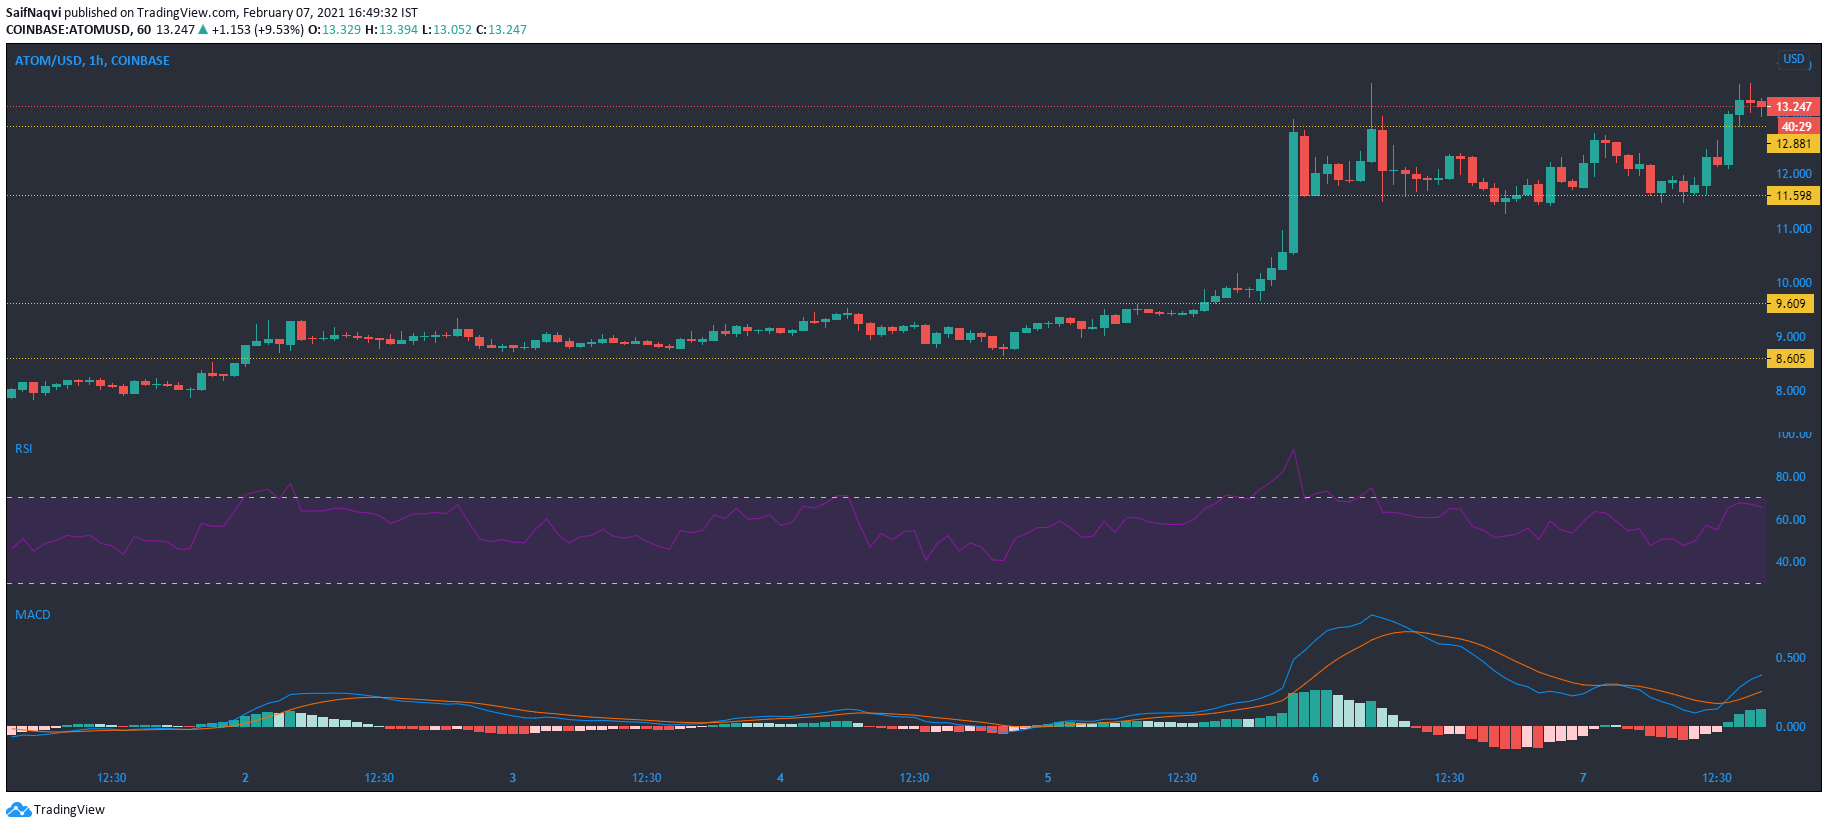
Cosmos continued its upward run on the charts with strong buying. The hourly chart showed the bulls managed to flip $12.8 resistance as the cryptocurrency scaled to a newer all-time high in the last session of trading. The indicators showed next to zero barriers for ATOM in the short-medium term and backed an extended bullish cycle over the coming sessions.
The MACD line moved well above the signal line, while the histogram noted rising bullish momentum. The Relative Strength Index was not yet at its tipping point as it settled just below the overbought zone. However, some skepticism arose from the fact that the 24-hour trading volumes contracted by over 30%. Support at $11.6 could come into focus in the event of a bearish pullback.
Zcash [ZEC]
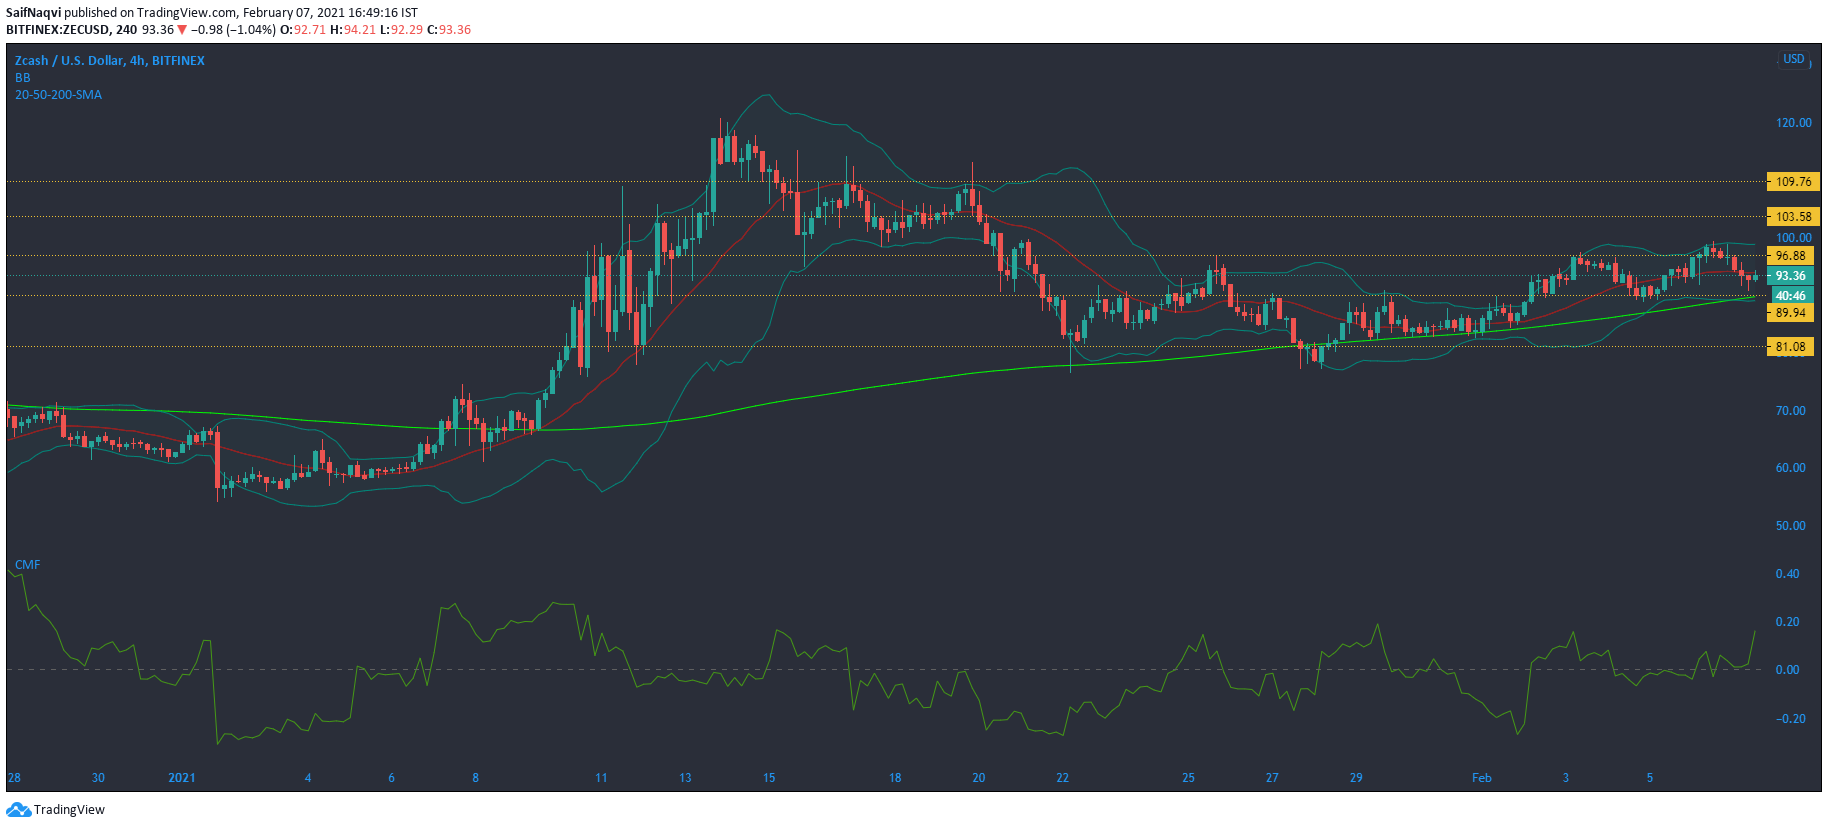
A slight pullback in market leaders BTC and ETH soured the sentiment for Zcash, which lost the $96.8 level. After the fall, some cautiousness was observed in its market as the buying activity and trading volumes remained low. Hence, a move above the current resistance mark was unlikely without bullish impetus from the broader market.
The Chaikin Money Flow showed that capital inflows helped cushion the losses as the index moved sharply above the half-line. The Bollinger Bands showed low volatility for ZEC as the price slipped below the 20-SMA. Although some rangebound movement can be expected over the next few sessions, losing out to the 200-SMA (green) could signal a downtrend over the medium-long term.