Binance Coin Price Analysis: 11 April

The Binance Coin market has been moving to new highs and as the market once again sees a sudden rally. BNB has grown more than 1000% since the beginning of the year from a mere $39 to $508.
At the time of writing, BNB had retraced from its all-time high and was being traded at $472 with a market capitalization of $4.96 billion, making it the third-largest cryptocurrency in the market in terms of market cap.
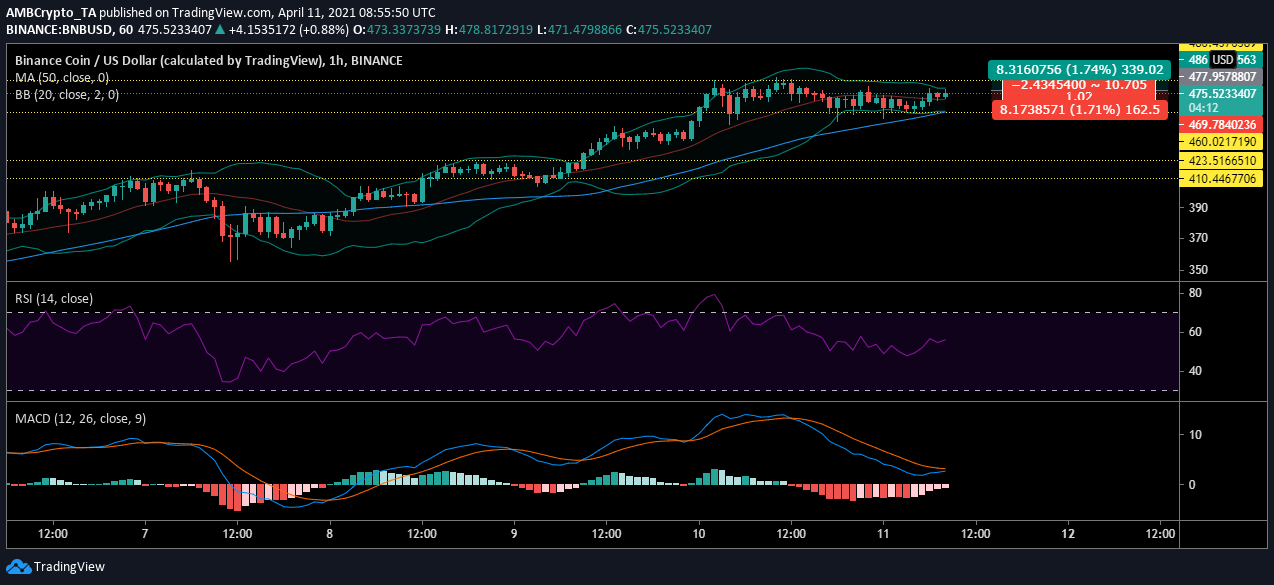
Binance Coin 1-hour chart

Source: BNBUSD on TradingView
The above chart of BNB suggested that the coin has been rising gradually on the charts. Although the digital asset has been moving within a restricted range over the past couple of days, the sentiment has been largely bullish.
The current price range in the BNB market was noted to be $460 and $486. As the price remained within this range there was a chance that the price will re-test the resistance, sending it higher on the price scale.
Reasoning
After strong movement in the market, the price of BNB has remained stable. This was highlighted with the limited volatility in the market indicated by the convergence of the Bollinger Bands. Whereas the signal line was still deciding between the bears and the bulls. The 50 moving average whereas was offering support to the candlesticks.
Meanwhile, the relative strength index has been noting that the digital asset was at an equilibrium stage, wherein the buying and the selling pressures were equal. However, the MACD indicator suggests the market has already taken a bearish turn as the MACD line crossed under the signal line. Nevertheless, the selling pressure was reducing and the MACD line may just reverse the trend by another crossover.
Crucial levels
Entry-level: $477.95
Take Profit: $486.27
Stop-level: $468.78
Risk to Reward: 1.02
Conclusion
The current BNB market has been close to its ATH and there could be buying pressure that would send the price to test the resistance here. However, the indicators have been showing that BNB may have to ward off the bears in the short term.


