Binance Coin reaches an area of supply, but will the downtrend make itself…

Disclaimer: The findings of the following analysis are the sole opinions of the writer and should not be considered investment advice
Binance Coin stands at the forefront of exchange tokens, at least in terms of market capitalization. As an exchange, Binance is also considered to be a leader in its support for innovation. In December, Binance announced a partnership with Code to Inspire, a US-based non-profit organization that aims to help and empower women in Afghanistan. Binance remains one of the largest crypto exchanges, in terms of trading volume, trading pairs, and liquidity. On the charts, Binance Coin has been shedding value steadily since November.
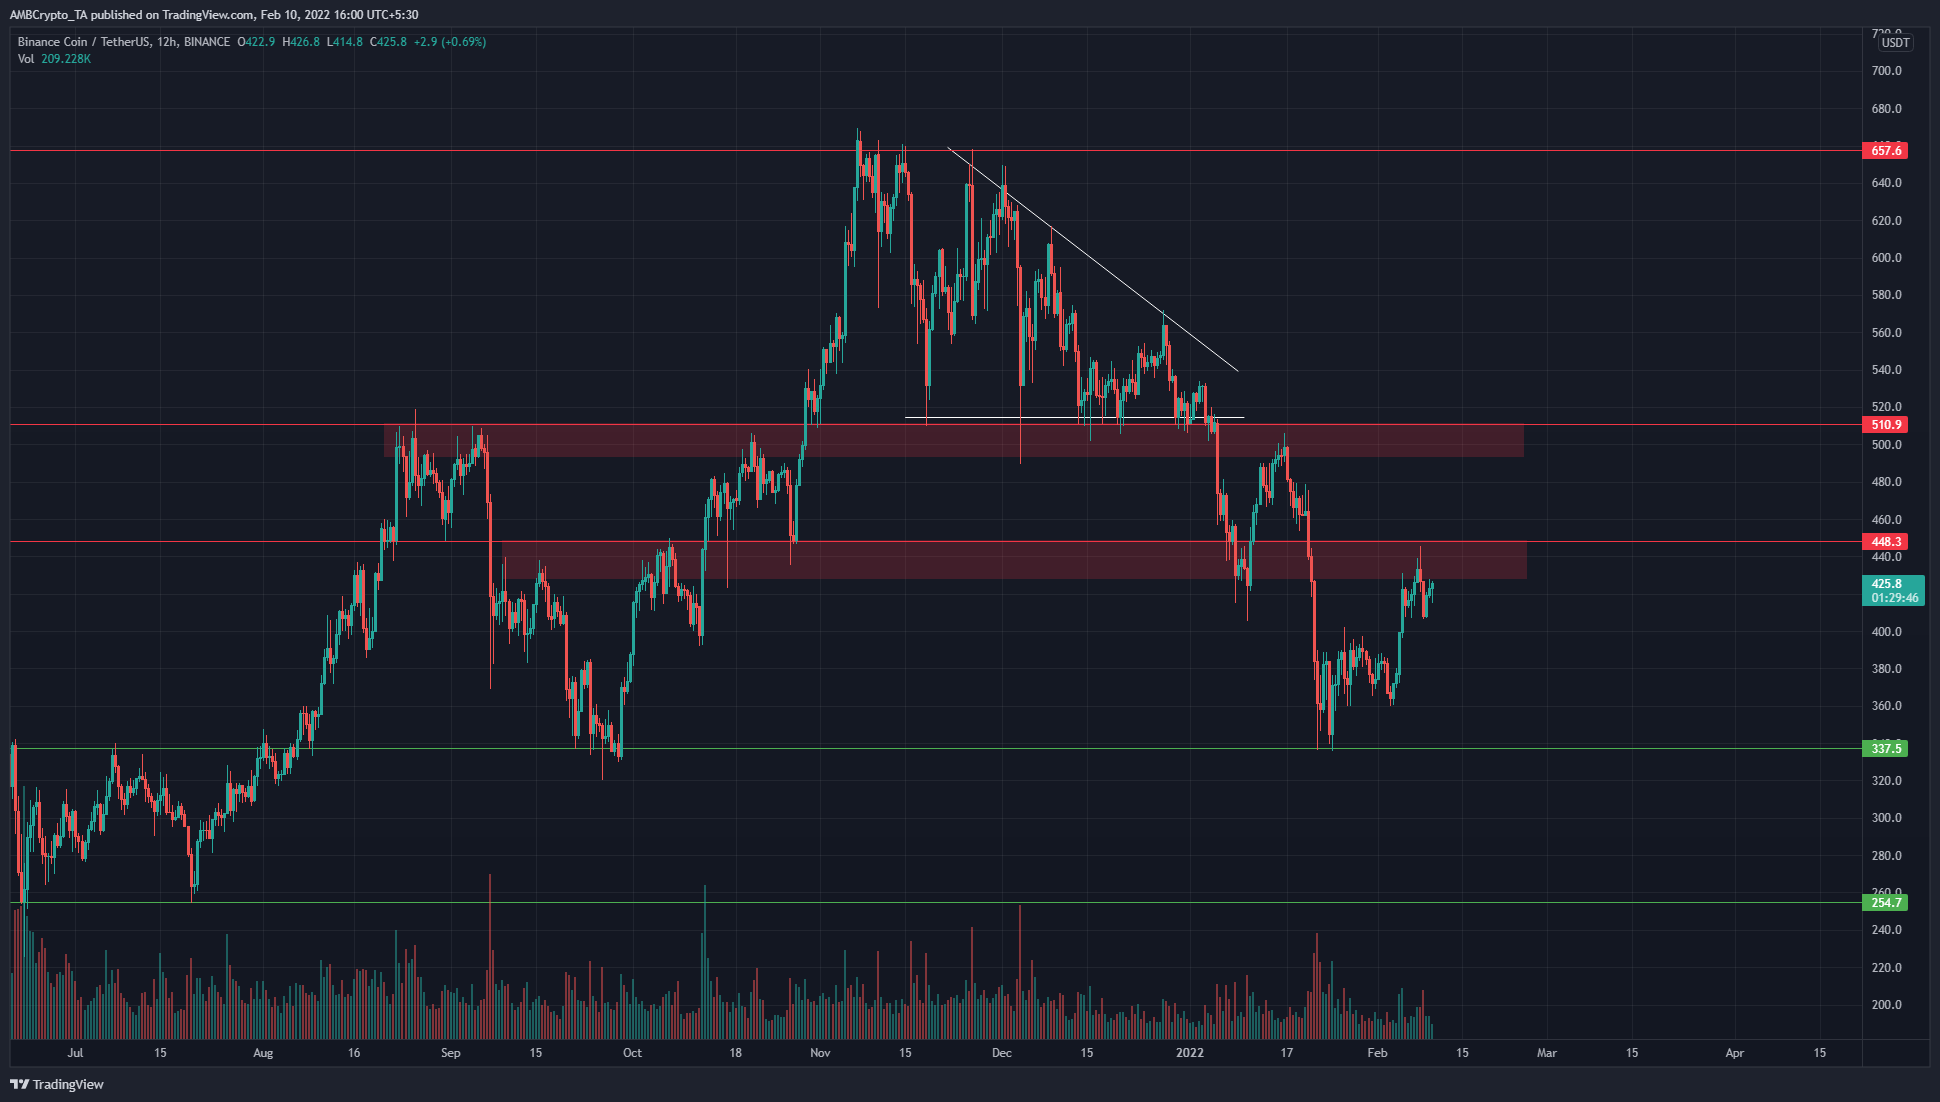
In November, BNB tested the $660 area and formed its ATH at $669. Multiple tests of this level were rebuffed, and in the past three months, BNB has been trending downward. Since July, however, the price has formed a base, first at $254 and then $337 in September, a level that BNB visited once again.
Therefore, an argument can be made that the price has formed higher lows since early 2021, and the most recent test of $337 could have been yet another buying opportunity.
However, the market structure since November, which was the time period of focus, was bearish- the most recent lower high was formed at $445.4 just a couple of days ago. The lower high prior to this one can be found at $506. These two areas are also areas of supply on the charts (red box).
To break the market structure, BNB would have to climb above $450 and retest it as support. Such a retest would be a feasible risk-to-reward area to enter long positions at, with take-profit orders layered all the way to $510. At press time, BNB appeared to have faced yet another rejection at a former area of demand.
Rationale
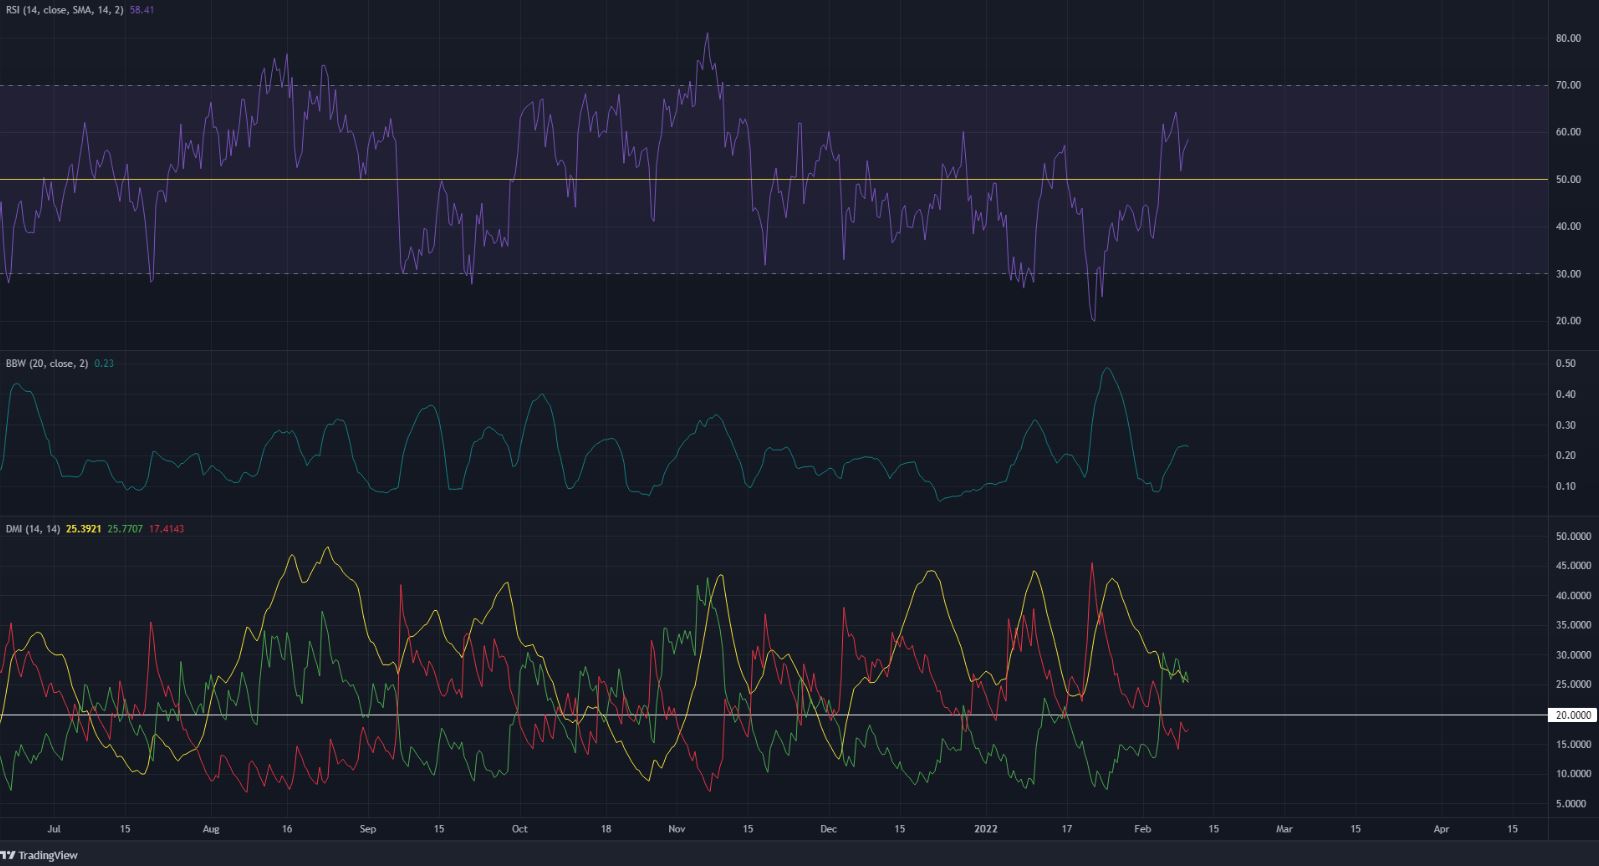
The 12-hour RSI climbed back above neutral 50 in response to recent bullishness. It has not crossed above 60 since November and has been below neutral 50 for the most part. Hence the RSI only highlighted the recent momentum upward but did not support a change in trend yet.
The Bollinger Bands width increased greatly in recent weeks, which showed periods of significant volatility for BNB. At press time, this volatility continued to remain high.
The DMI showed a change in trend from bearish to bullish as the ADX (yellow) and +DI (green) moved well above the 20 value.
Conclusion
In the next couple of weeks, the $450 and $400 areas of supply and demand respectively can be monitored for signs of a break north or south. A move past $450 and its retest would likely be a buying opportunity and signal that demand was strong enough to push BNB toward $515.