Binance Coin retests $315 as resistance, is it the right time to go short

Disclaimer: The findings of the following analysis are the sole opinions of the writer and should not be considered investment advice
- Daily structure strongly bearish following rejection at $360
- $280 and $260 are levels to watch out for, but it could be risky for the bulls
Binance Coin crashed as far south as $260 on 9 November. The bounce to $313 turned out to be a bearish retest, and the coming days could see another leg downward for the exchange token.
Read Binance Coin’s Price Prediction for 2022-23
The 24 hours preceding press time showed 50.5% of participants to be bearishly positioned. The futures market showed seller dominance as well. Long-term buyers would need to exercise caution, while lower timeframe traders might relish the volatility.
$260 saw a bounce in prices but bears remain in control
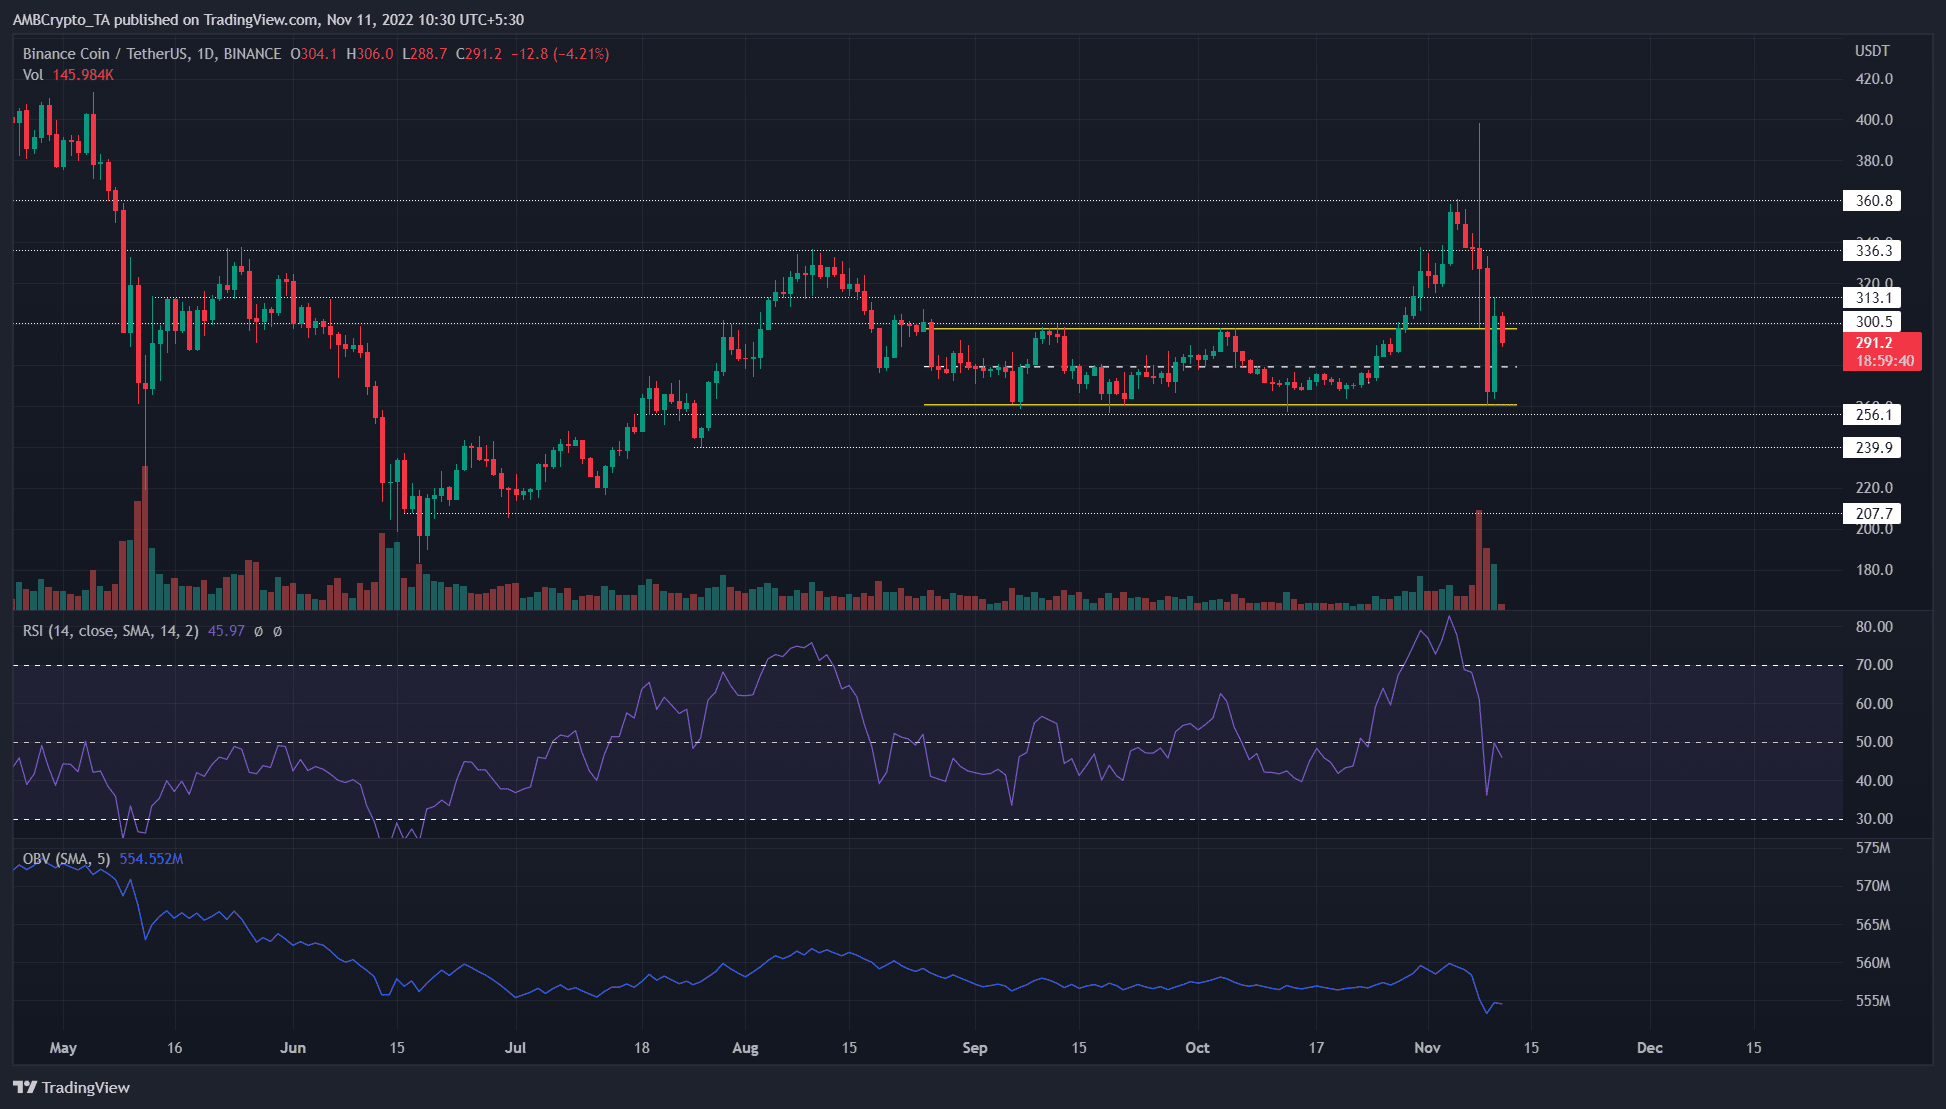
On the daily chart, Binance Coin had a strong performance in October. The term “Uptober” can apply favorably to the latter half of the month as the price rallied from the $256 swing low to reach $360 on 4 November.
However, things have taken a drastic downward turn in the past week. The news surrounding the FTX exchange has shifted market sentiment to a strongly bearish position.
Binance Coin saw heavy volatility in recent days. 8 November saw BNB swing from a high at $398 to a low of $298. Since then, the price has broken beneath the range (yellow) it traded within from August to October.
BNB dropped as low as $260 on 9 November, the day when Bitcoin reached $15.8k. Its prospects did not look positive in the coming weeks.
The higher timeframe market structure was firmly bearish. Moreover, the $300-$315 area was retested as a resistance as well. The OBV saw a sharp dive in the recent wave of selling. The RSI retested neutral 50 as resistance as well, when BNB bears flipped $300 to resistance.
Taken together, the outlook was bearish on higher timeframes. Yet, some volatility was very likely on the lower timeframes as hope and fear appeared to grip the market alternatively on an almost hourly basis.
The $280, $260, and $240 levels were likely to be tested once more. Further south, the $210-$218 area could also see some demand arrive. Hence, buying at any of these levels can come with a lot of risk attached.
Funding rates are negative while Open Interest sees a sharp drop

Source: Coinglass
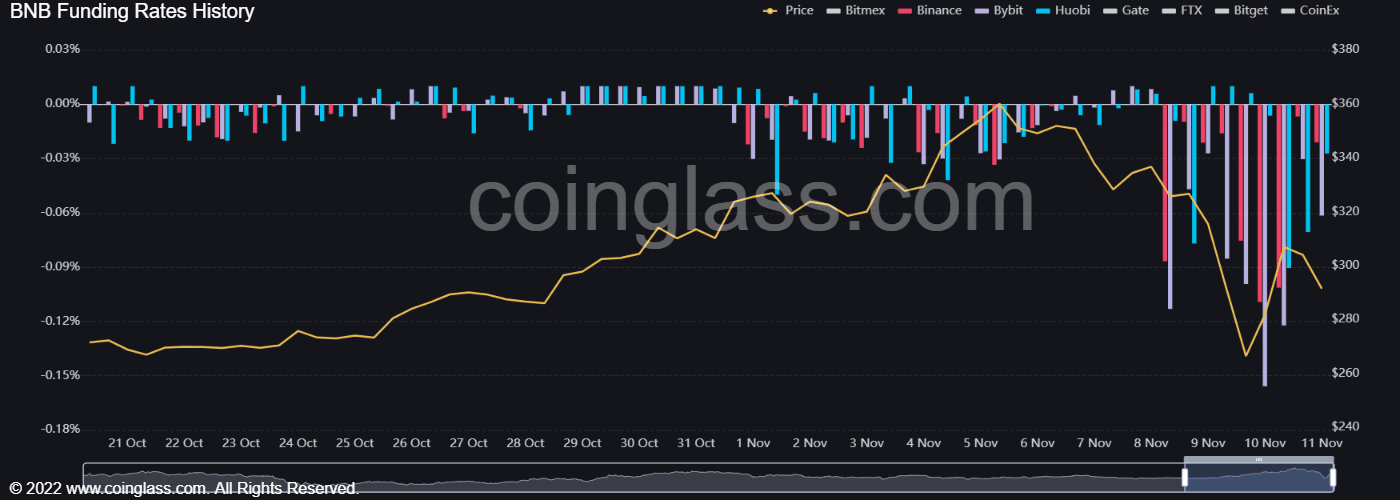
The funding rate has been extremely negative in the past few days, with figures as high as 0.1%. This showed that the futures market participants were positioned heavily bearishly.
The flip side of this observation was that a sudden surge in prices could cause en masse liquidations and drive a liquidation cascade upward.

Source: Coinglass
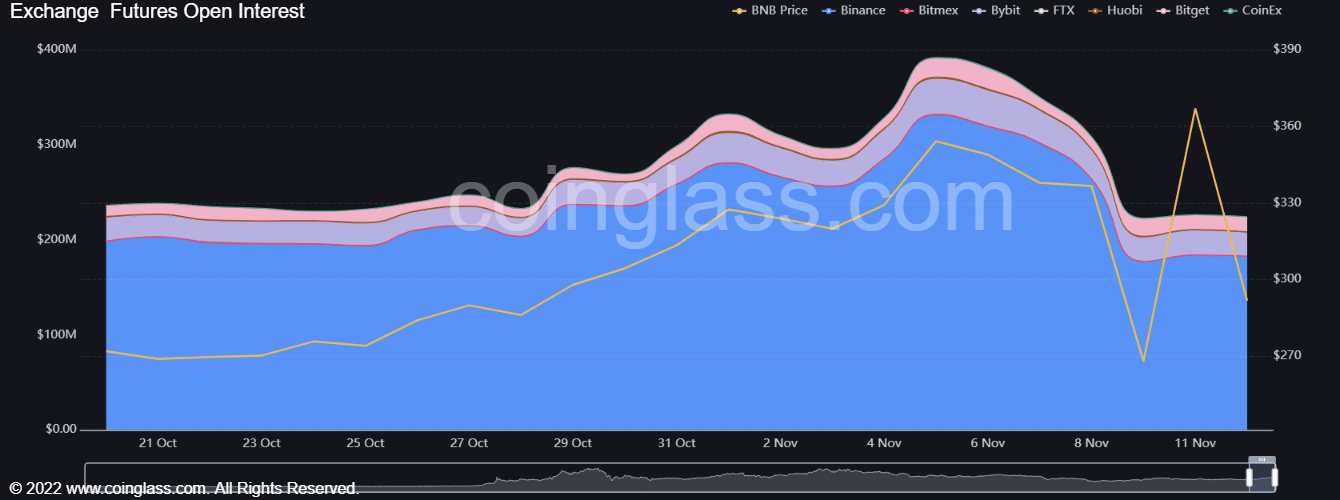
The Open Interest chart also showed a decrease in OI in the past week after the local top formed at $360. The bulls who fueled the previous rally had likely been forced out of the market. A rise in OI alongside a fall in prices in the coming days would show bearish strength.
Given the risky conditions for bulls in the market, it could pay for bulls to wait patiently for this storm to blow over. It was unclear how long it could take. With Bitcoin showing weakness below $18k, Binance Coin could quickly drop below substantial support levels once again.


