Binance Coin, STEEM, Dash Price Analysis: 13 February

Binance Coin seemed to be in a period of consolidation as the price cooled off from its record levels. STEEM looked poised for a reversal as the indicators flashed red signals, at the time of writing. Finally, DASH was able to maintain its upward trajectory on the back of strong buying pressure.
Binance Coin [BNB]
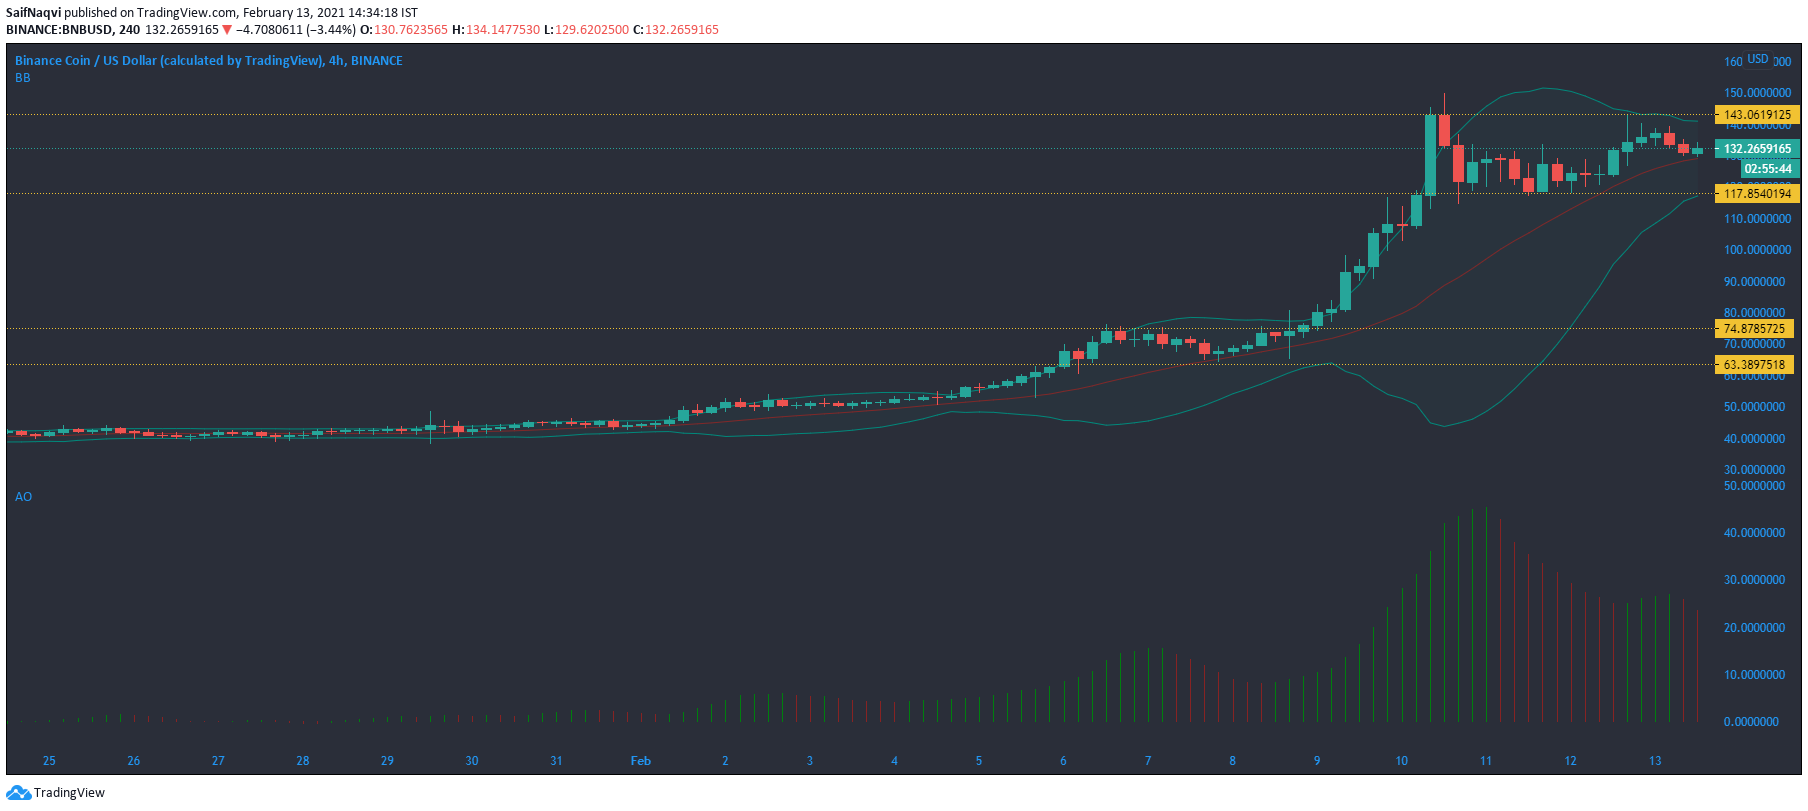
The Bollinger Bands on Binance Coin’s charts underlined that the period of high volatility, one that saw the cryptocurrency post gains of over 100% in the past week, was finally coming to an end as the bands were converging. At press time, the market was in a state of equilibrium as the crypto’s price traded around the midpoint of its immediate support and resistance levels.
The Awesome Oscillator sided with the bears as the histogram’s bars switched to red. In a bearish outcome, the crypto’s price could slip below the $117.85-support. A bullish outcome would see BNB snap a newer all-time high. Traders may be advised to hold on to their positions before a clear trend emerges.
STEEM
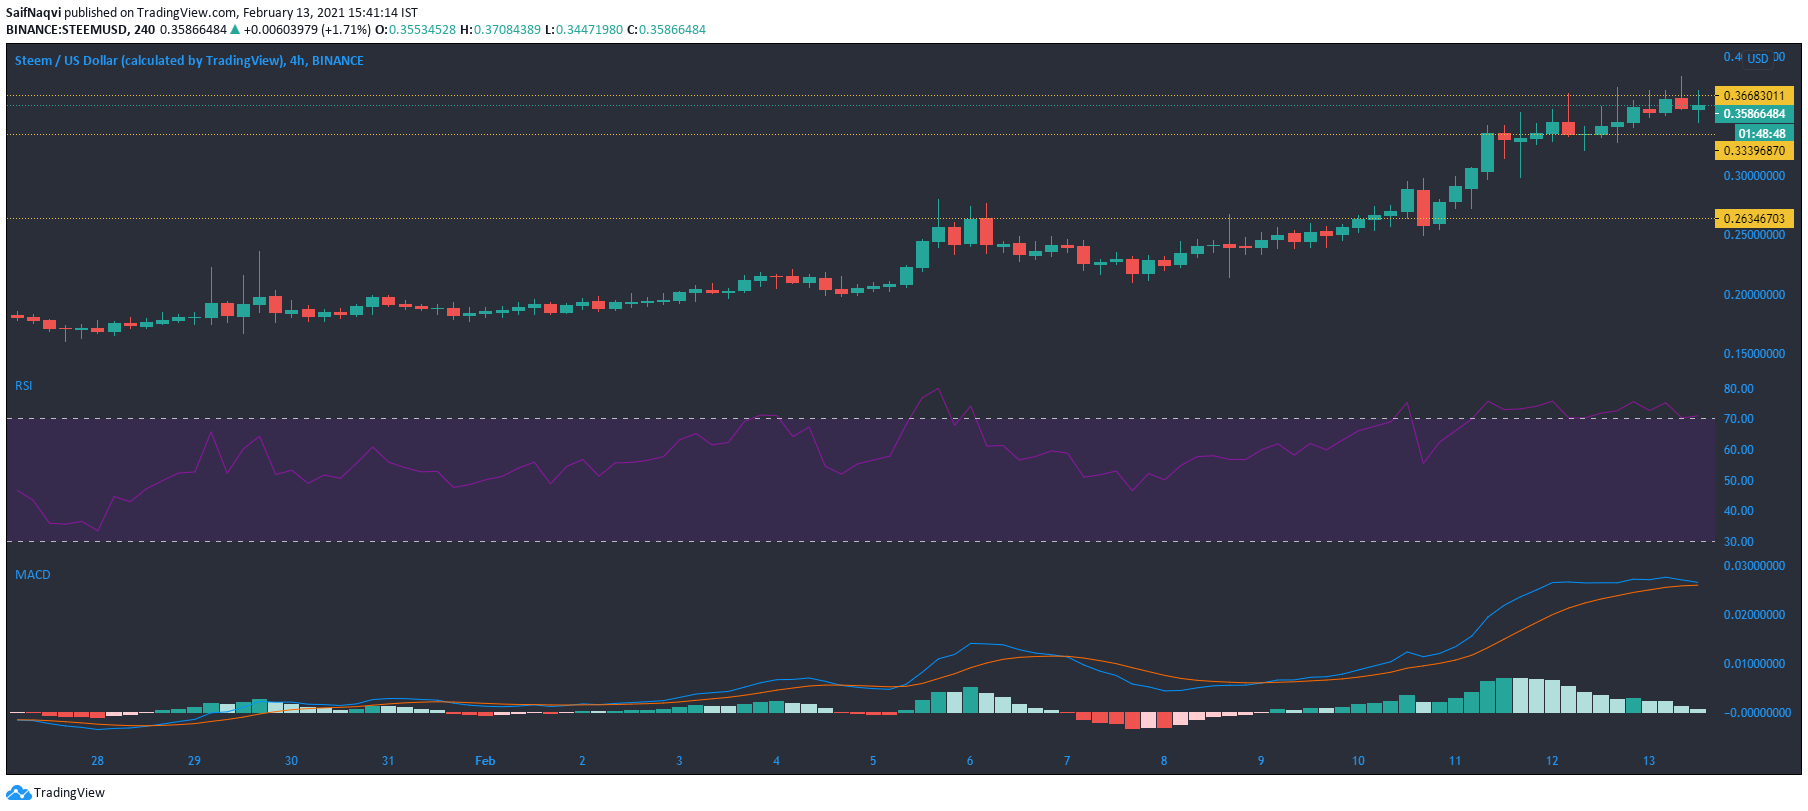
Like most other altcoins that have benefited from the crypto-market’s rally, STEEM has also been on an uptrend over the last seven days by snapping higher highs and higher lows on its 4-hour chart. STEEM was trading at its local high, at the time of writing, as the bulls attempted to flip the $0.366-resistance level.
The crypto’s on-chain metrics suggested that bearish potential was on the cards as the RSI moved into the overbought region. This was backed by the MACD which was on the verge of a bearish crossover. However, bullish cues from the broader market could negate any bearish predictions.
Dash [DASH]

A hike in the On Balance Volume would be one of the most accurate ways to assess the recent buying pressure on DASH. A look at the 4-hour chart showed a cordon of bullish candlesticks as the price climbed above the $220-level even though the Stochastic RSI traded in the overbought zone.
With momentum strong on the buying side, DASH’s bullish cycle could spill onto a few more trading sessions before an eventual correction. A fall in trading volumes and buying activity would represent the onset of a bearish pullback.