Binance Coin, Synthetix, Zcash Price Analysis: 27 January

Binance Coin was trading within a restricted channel and it awaited further direction from the broader market for a breakout. SNX flipped the $17-resistance level, but the indicators suggested that bullish momentum was slowing down. Finally, ZEC moved closer to its 200-SMA and a fall below that level would confirm a bear market trend.
Binance Coin [BNB]
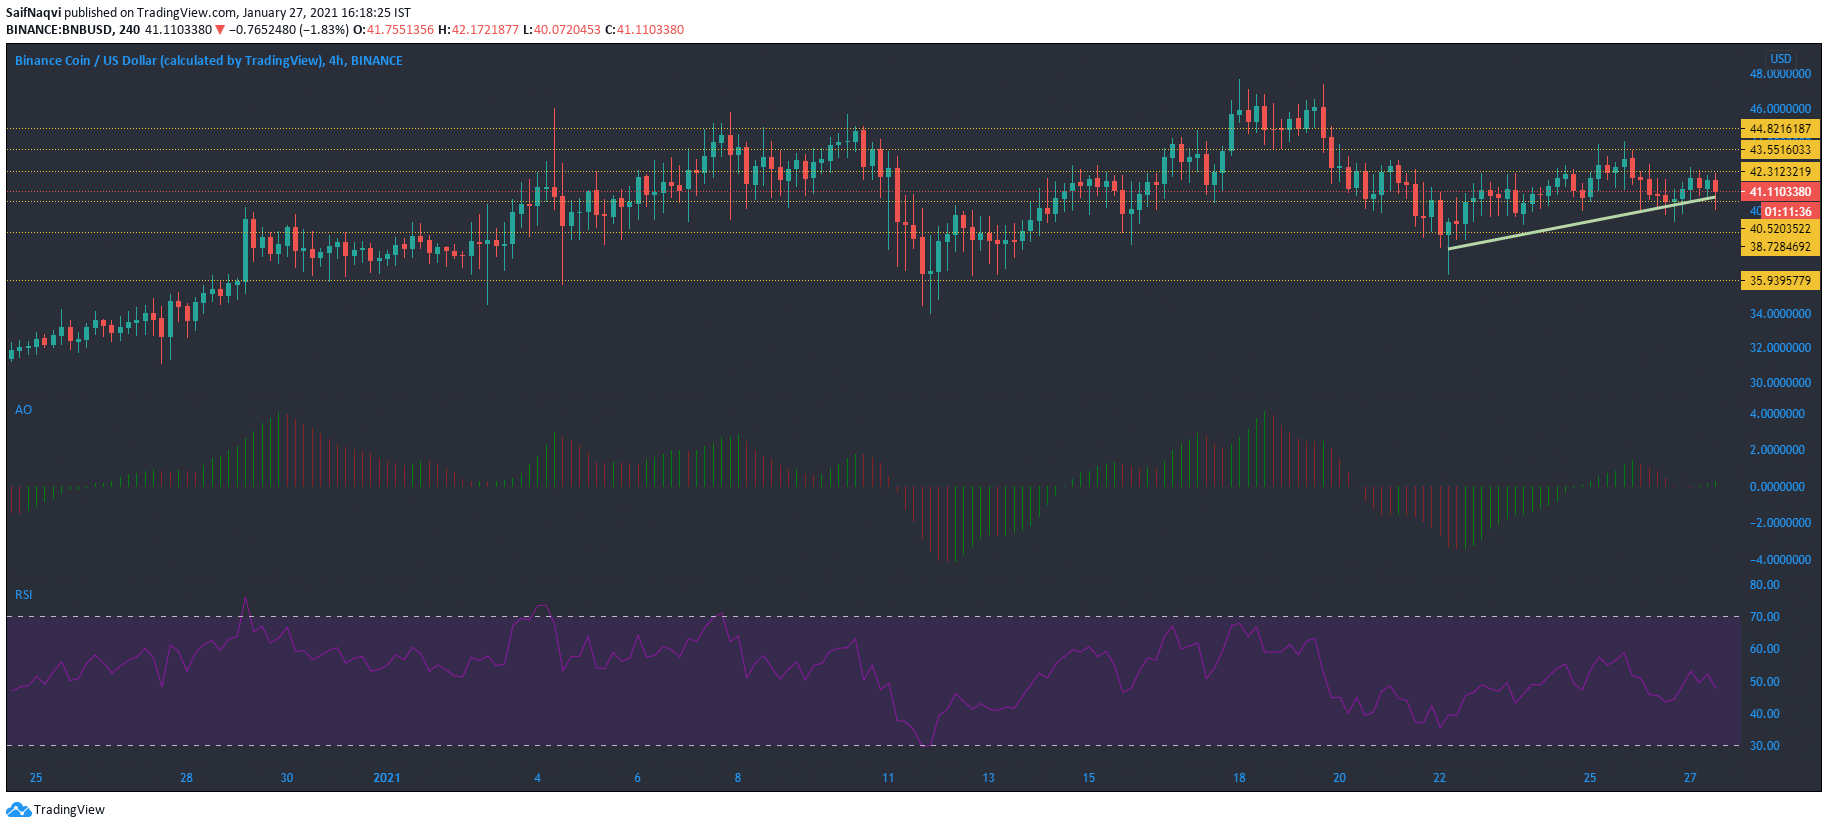
Binance Coin was little changed over the last 24 hours as the crypto-asset traded at $41, up by 0.6%. In fact, BNB saw some consolidation over the past few trading sessions and the price moved between a fixed channel of $41.9 and $40.5. The price might continue to move within the said channel and a breakout in either direction would depend on further cues from market leaders Bitcoin and Ethereum.
The Awesome Oscillator suggested that momentum was bullish-neutral.
Although the Relative Strength Index was pointing south, it remained in the neutral zone and did not underline a strong move in either direction.
Synthetix [SNX]
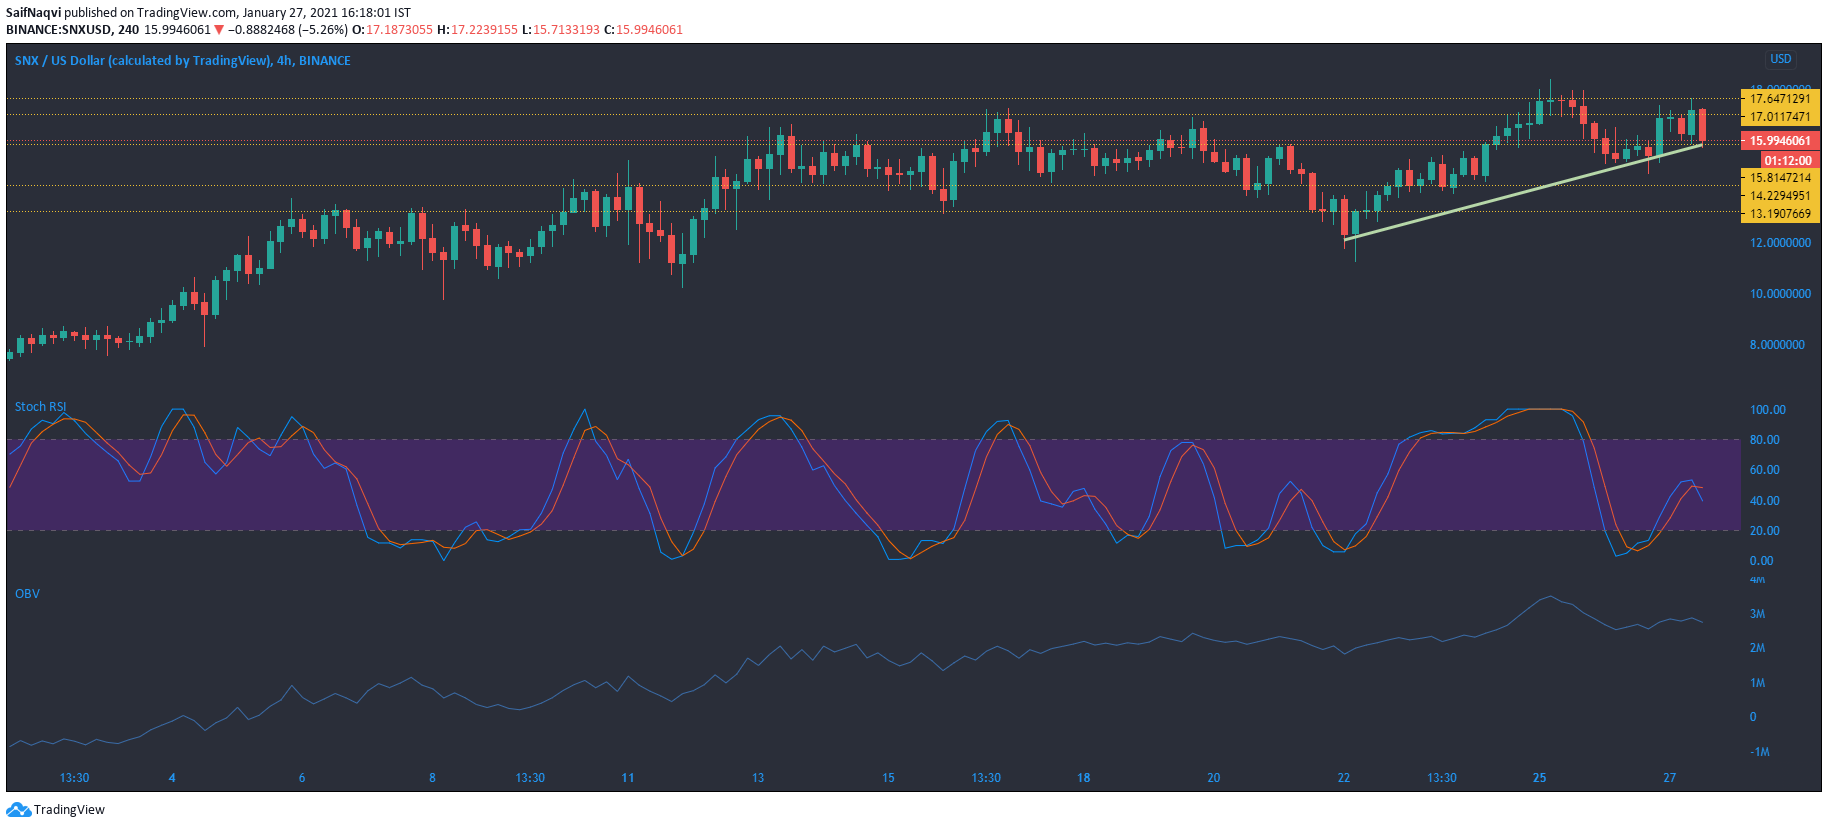
The final session of trading saw some bearish movement after SNX managed to flip the $17-resistance. Lower trading volumes and subdued buying activity over the last 24 hours suggested that bulls could struggle to maintain SNX above its resistance level and a move towards the $15.8-support level was a likely outcome.
The Stochastic RSI witnessed a bearish crossover and the index was pointing towards the oversold zone, while the On Balance Volume showed muted buying activity.
Zcash [ZEC]
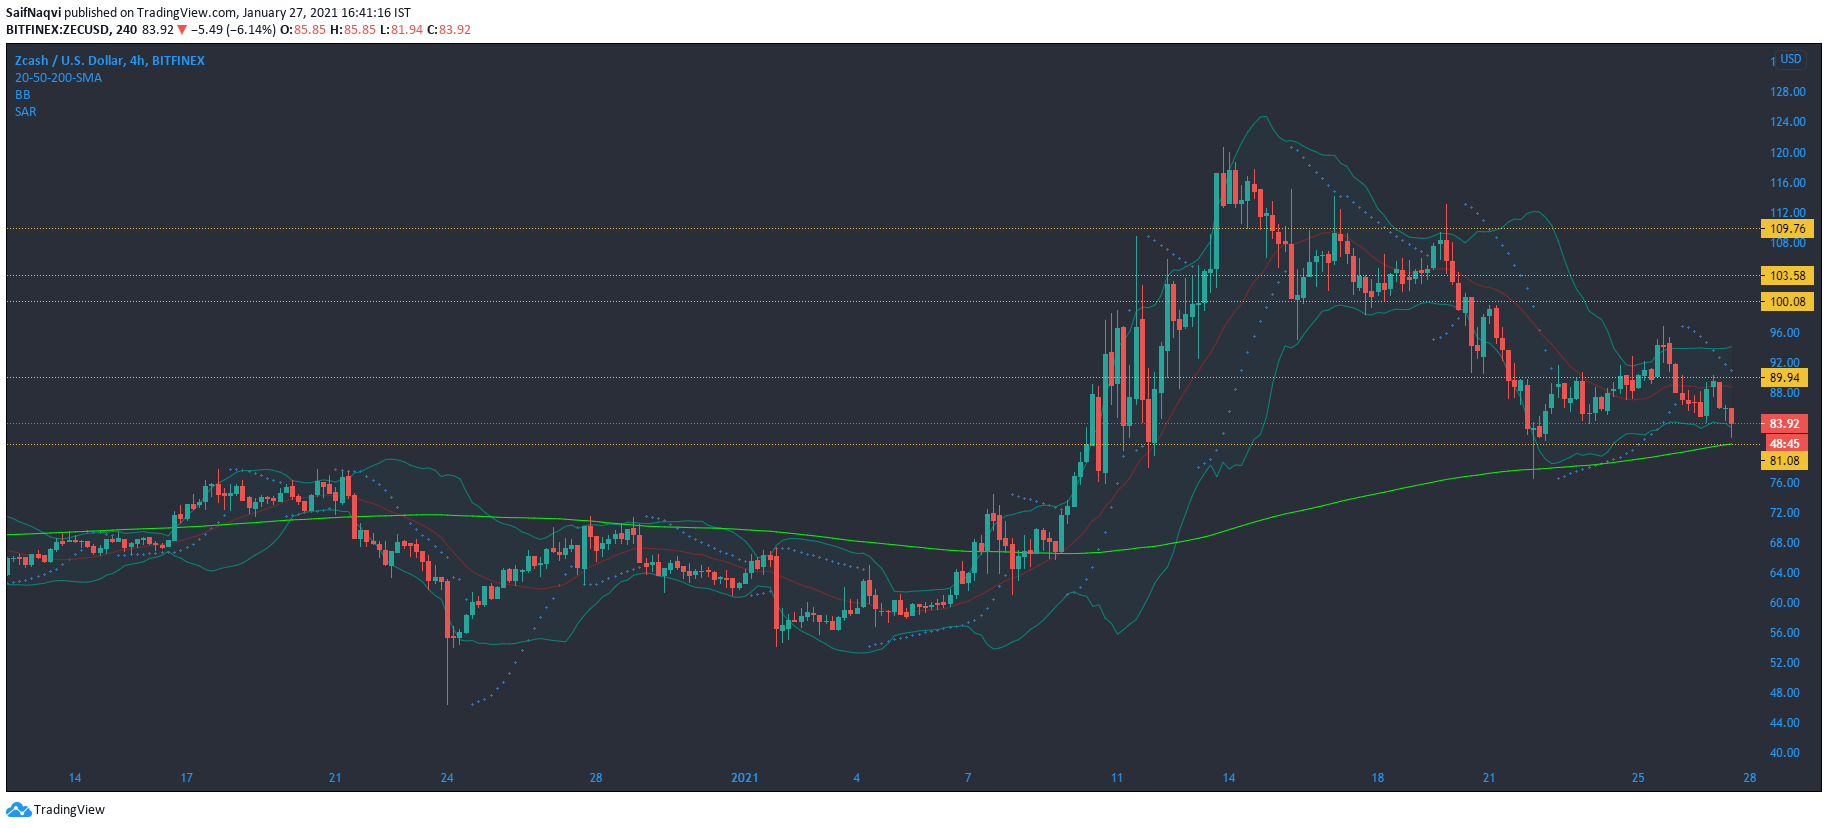
Zcash has had a rough week, one that has seen the price fall below several support levels. In fact, ZEC was one of the biggest weekly losers among the top-50 coins by market, with losses of over 16% in seven days. On the charts, the price moved towards the 200-SMA (green), a level which is expected to offer support to the price in case of an extended fall. A dip below the 200-SMA would present some strong sell signals and confirm the bearish cycle over the last two weeks.
The Bollinger Bands noted low volatility in prices as the bands were compressed. The candlesticks could continue to move between the Signal line and the lower band in a bearish scenario.
Meanwhile, the Parabolic SAR’s dotted markers were above the candlesticks and highlighted short-term bearishness over the past couple of days.