Chainlink Price Analysis: 27 January

Disclaimer: The findings of the following analysis are the sole opinions of the writer and should not be taken as investment advice
Chainlink’s price was highlighting the promise of a surge, one that could range anywhere between 18% to 40% over the next month. This surge will be pivotal to the project’s prospective listing by the Grayscale Investment company. It should be noted though that while the rumor got some credibility recently, Grayscale hasn’t announced the listing of these assets yet.
At press time, LINK was trading at $21.42 with a market cap of $8.6 billion, with the altcoin ranked the seventh-largest cryptocurrency on CoinGecko. After recording a 3.2% surge over the previous week, the oracle platform token might be witness to yet another surge soon.
Chainlink 6-hour chart
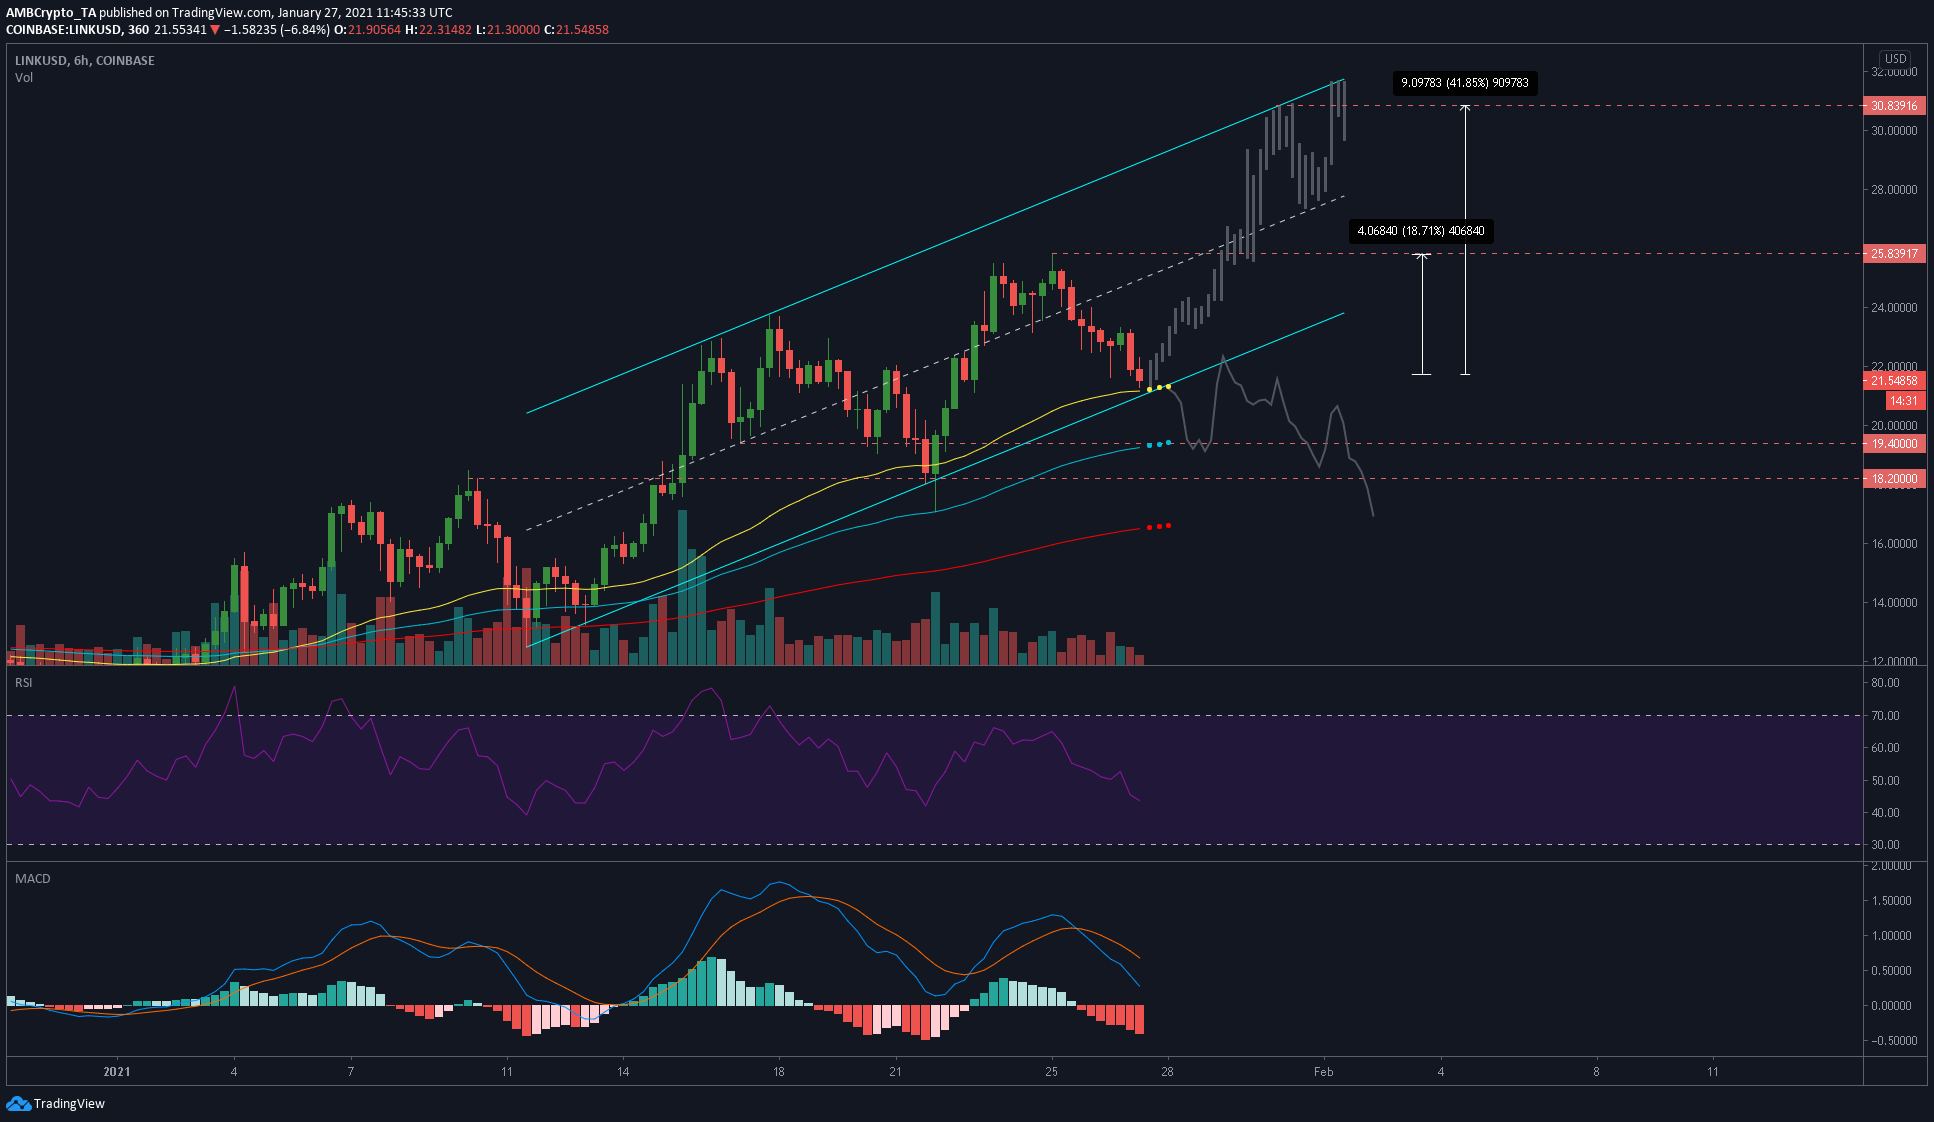
The attached chart highlighted that Chainlink was in a massive bearish ascending parallel channel pattern. The price got close to hitting the upper trendline, but failed after two tries. However, these attempts were what pushed LINK past its previous ATH and towards the new ATH at $25.8. Since hitting the new ATH, LINK’s price has seen a pullback down towards the lower trendline of the parallel channel, where it stood at press time.
Not only was the price being supported by the lower trendline of the channel, but the short-length EMA [yellow] was also preventing the price’s collapse. Hence, the price seemed to be primed for a bounce.
Adding more credibility to this bounce were the RSI and the Stochastic RSI, with both underlining a dip towards the oversold zone and loss of downward momentum. Finally, the MACD indicator was well below zero on the 6-hour chart, showing no signs of heading higher.
Conclusion
Overall, LINK’s price looked bearish on the charts, but considering the aforementioned supports, the bullish scenario also makes sense. There are two scenarios as to how the price could evolve.
In the first scenario, the price will bounce from the lower trendline of the channel or the mid-length EMA [blue] and head higher. This uptrend will have the potential to push the price up by 18% to 40% to $25.8 and $30.8, from where the price stood at press time.
A continuation of the downtrend after closing below the lower trendline would push the price down to $19.4 or $18.2, a development that would mean a 10% to 15% drop from the press time price.


