Binance Coin, VeChain, EOS Price Analysis: 15 December

While Bitcoin entered the $45,000 zone on 13 December, the domino effect led Binance Coin and VeChain to breach their long-term resistance levels. Moreover, EOS still struggled to cross the 38.2% Fibonacci hurdle.
Binance Coin (BNB)
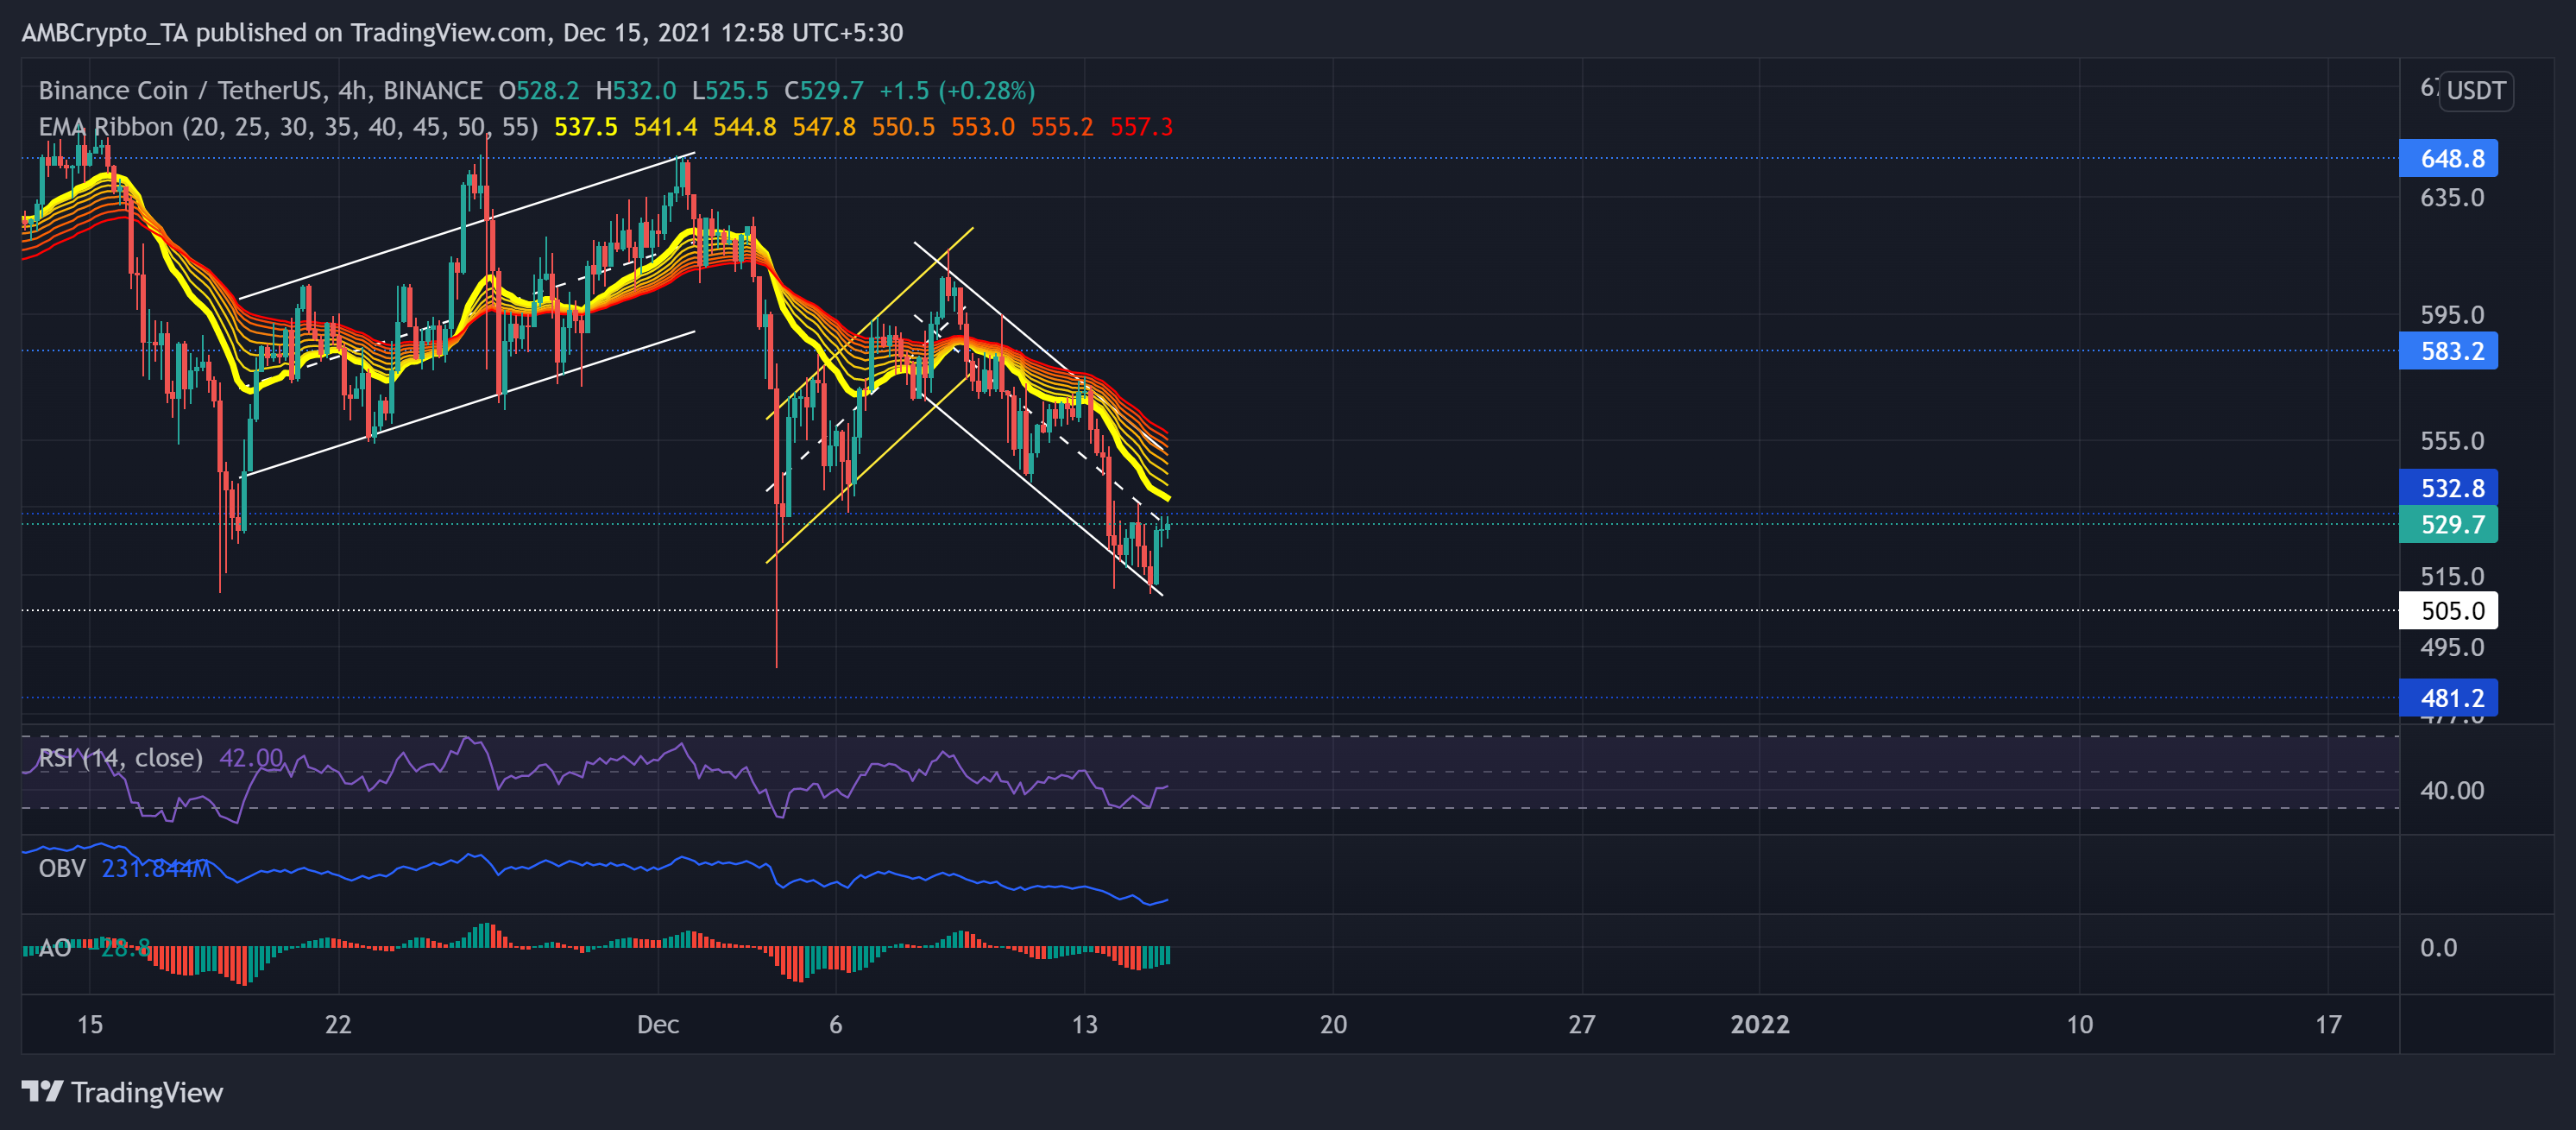
BNB formed a descending channel (white) after an up-channel breakdown on 9 December. As a result, the alt saw an 8.9% seven-day loss. With this downfall, the bears pushed the price below its immediate resistance at the $532-mark. The bears retested the above level for nearly 45 days until they finally sustained the price below that mark for over two days now.
Over the past two days, BNB bulls endeavored to test the $532-mark thrice but failed to surpass it. However, the selling pressure has not yet negated its long-term bullish trendline. Now, the down-channel midline (white, dashed) and the lower EMA ribbon (dark yellow) stood as an immediate hurdle for the alt to conquer.
At press time, BNB traded at $529.7. The RSI moved sideways below the half-line but showed slight revival signs. To top that up, OBV projected a steadily increasing bearish sentiment. Nevertheless, the AO exhibited a slight increase in bullish force as the crypto noted a 1.3% 24-hour gain.
VeChain (VET)
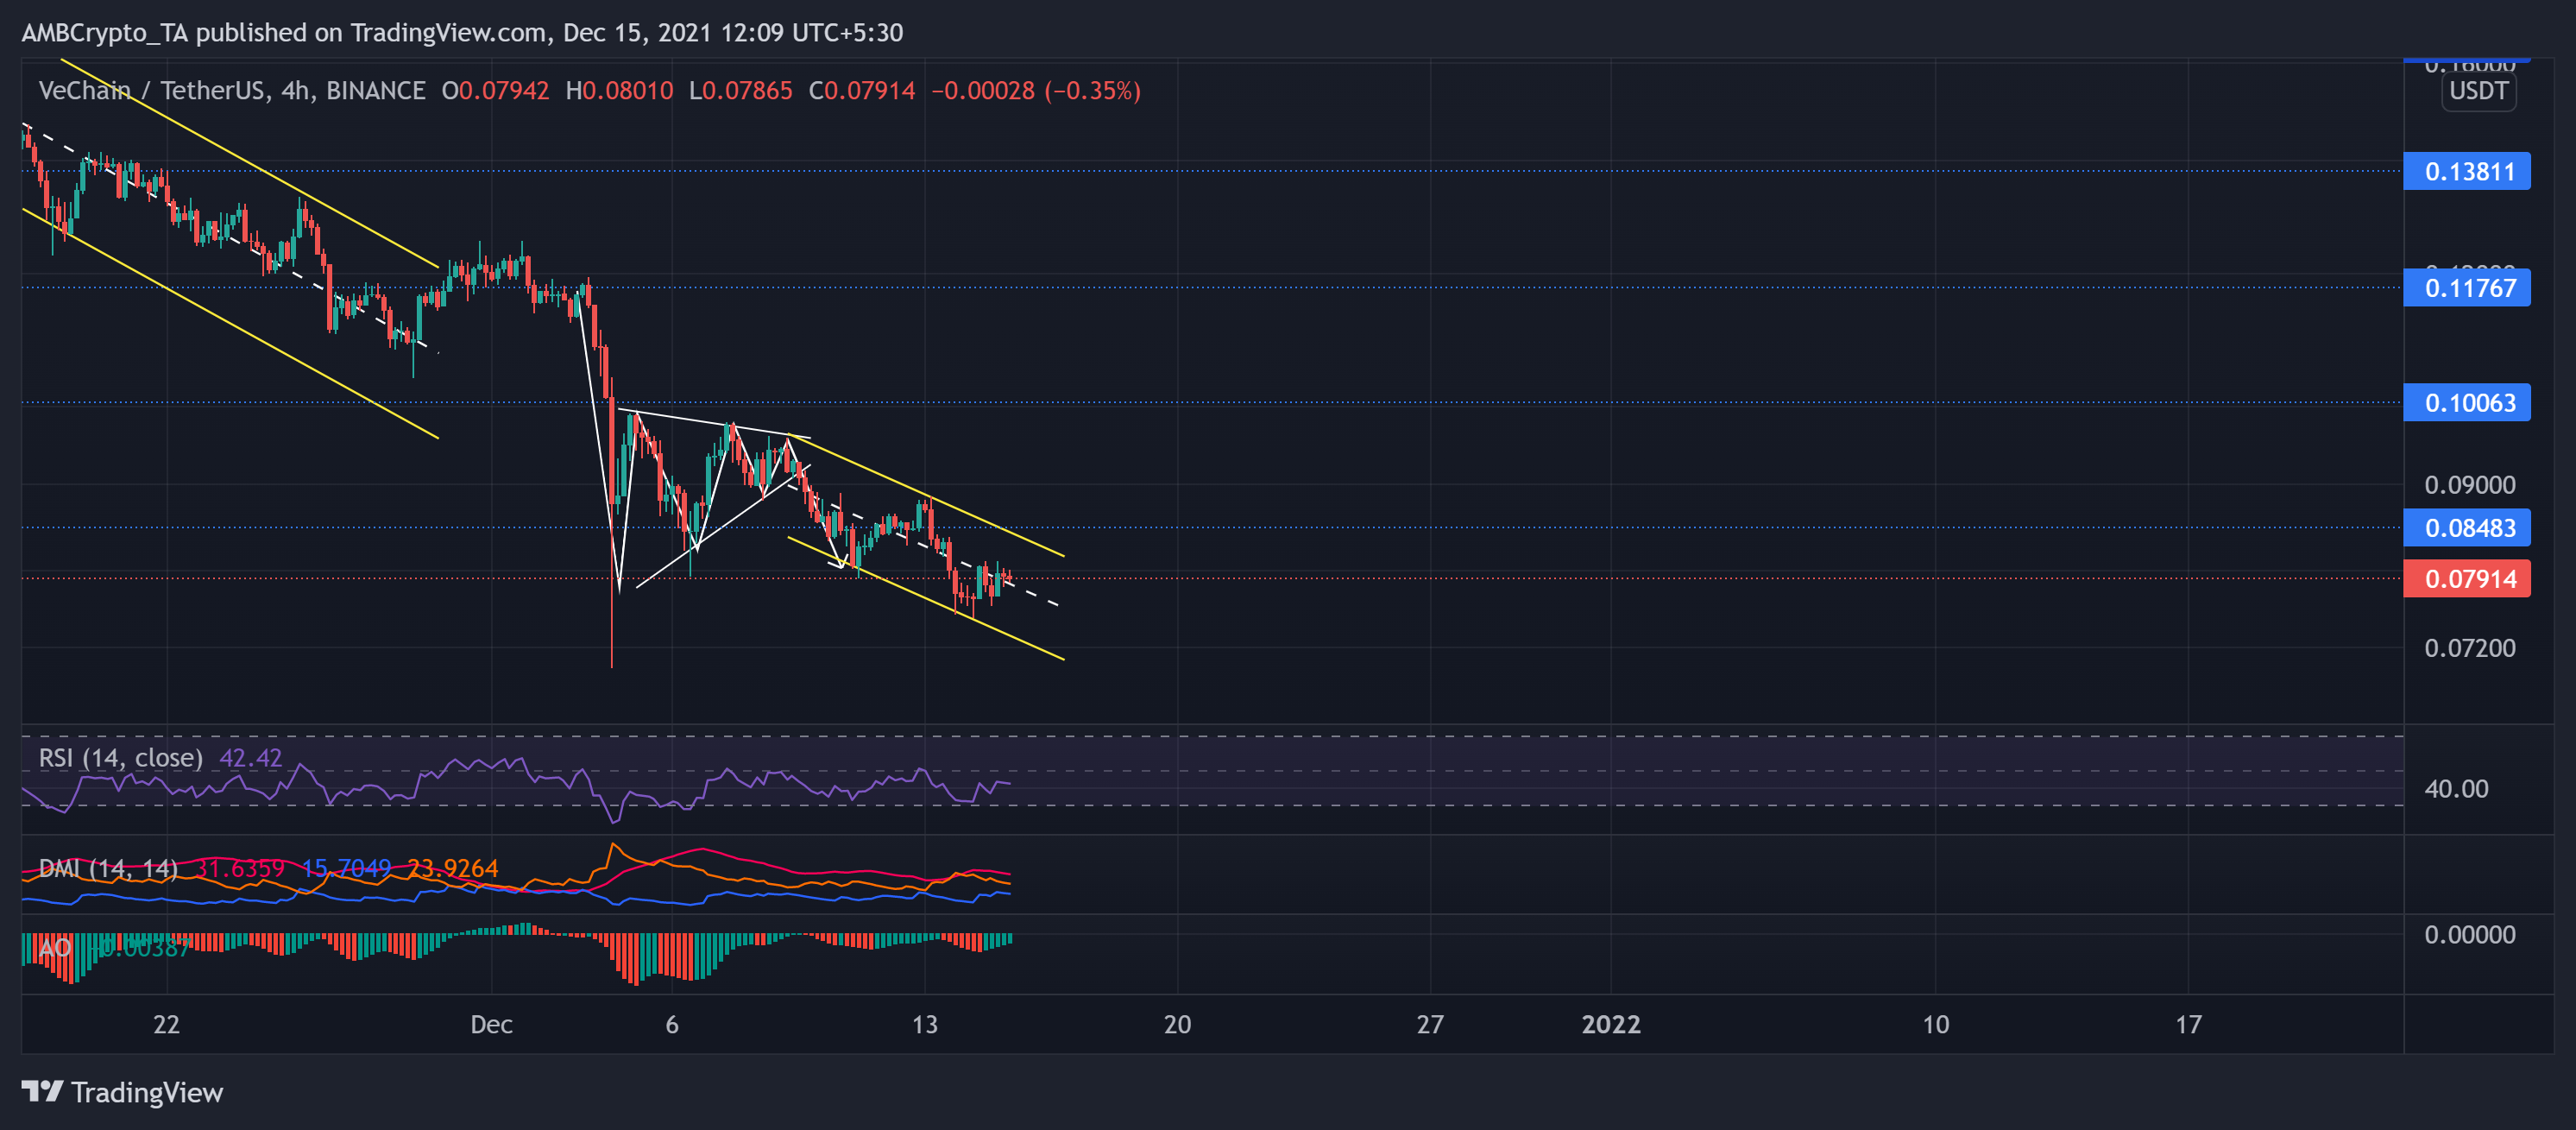
VET’s bearish gravitation expedited after an expected bearish pennant breakout on 9 December. This fall transposed into a down-channel after the alt noted a 13.7% decline on its weekly chart. It steadily declined in the past month after poking its six-month high on 9 November.
Since then, the altcoin saw a staggering 51.2% 30-day decline and disapproval of its long-term bullish trendline. This fall led the bears to breach the four-month-long bull resistance at the $0.084-mark.
At press time, the alt traded at $0.07914 after noting a 5.8% 24-hour gain. On the 4-hour timeframe, VET’s RSI practically struggled to breach the midline for over a month now, depicting a substantially strong bearish influence. Moreover, it showed no near-term revival signs. Also, the DMI lines confirmed the bearish outlook while the AO displayed the 24-hour bullish push.
EOS

Over the past 13 days, EOS managed to form a symmetrical triangle after a down-channel breakdown on its 4-hour chart. Also, after poking its 6-week low on 3 December, the alt saw an upturn above the 38.2% Fibonacci resistance but failed to sustain that level. As a result, the price action plunged below that level after marking an over 11% loss in the past week.
EOS constantly downturned after poking its seven-week high on 10 November. At press time, EOS traded at $3.345. Now, the bulls will again try to restest the 38.2% level before a possible upturn. The near-term technicals for the coin flashed mixed signs.
The RSI was just above the midline but showed slackening signs. Additionally, the DMI and AO displayed a bullish inclination. Nonetheless, the ADX depicted a weak directional trend for EOS.


