Analysis

Binance Coin, XRP, Tron Price Analysis: 24 October
Posted:
| Last updated: January 30th, 2024

Cryptocurrency prices continued to give mixed signals of green and red on 24 October. The likes of Binance Coin, XRP, and Tron noted a decline in the last 24 hours. However, a macro view suggested that the crypto market skewed in favor of altcoins.
Binance Coin and Tron displayed a gradual increase in their price trends by registering weekly gains. On the other hand, XRP showed a preference for selling strength by a decline in its value over the last week.
Binance Coin (BNB)
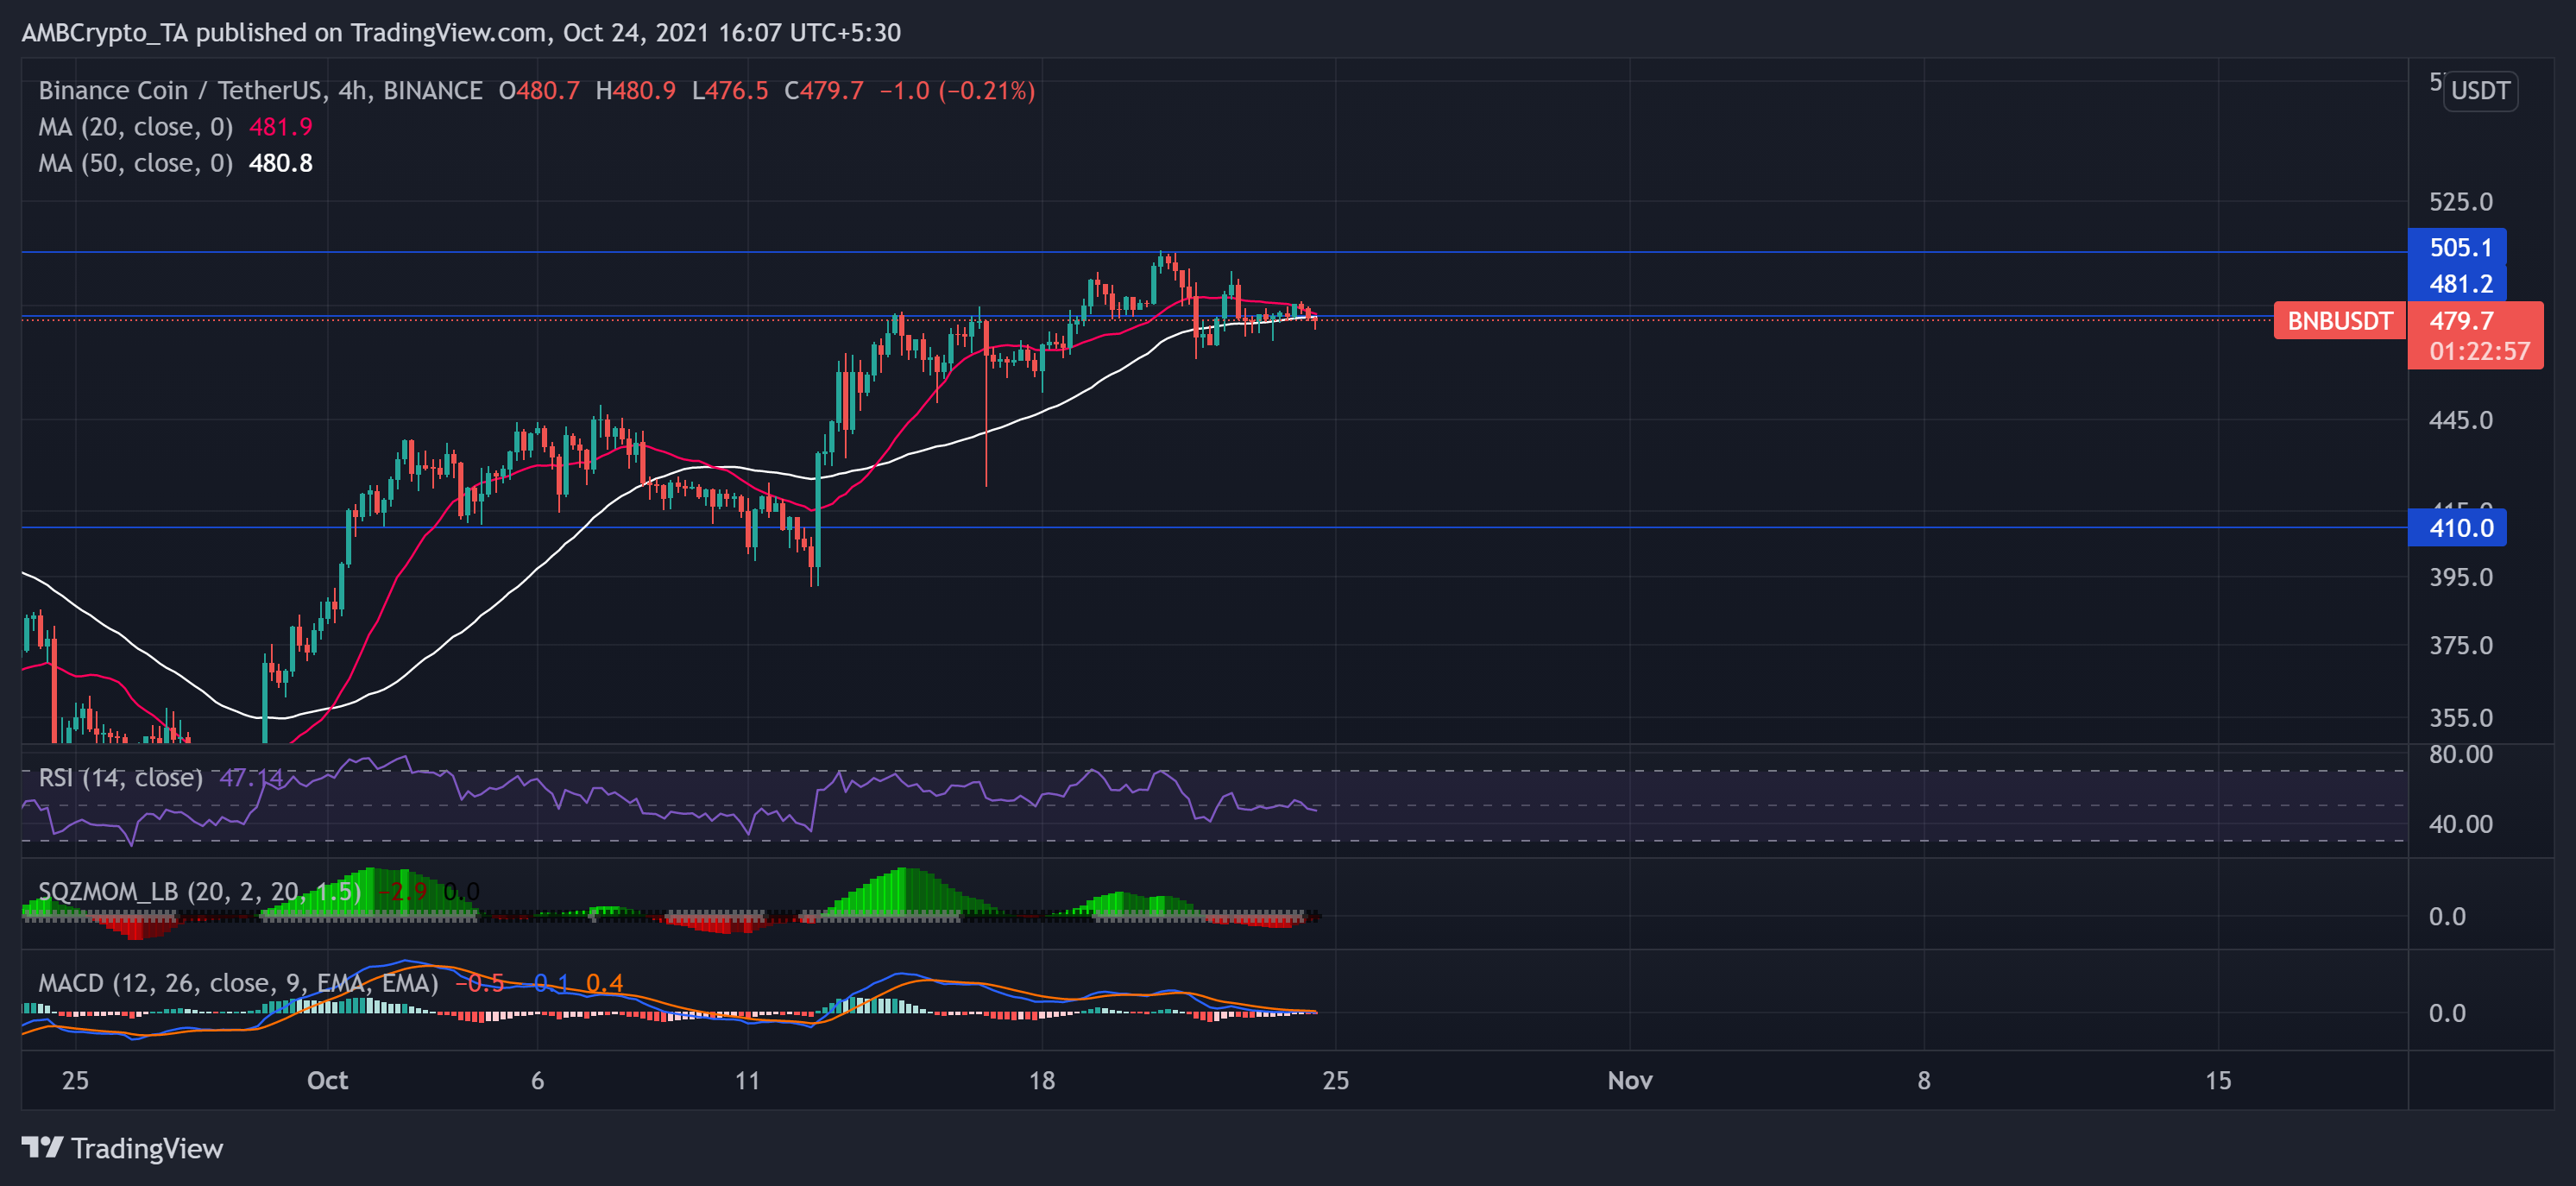
Source: TradingView, BNB/USDT
BNB’s price oscillated within the confines of an up-channel as it noted a 1.81% seven-day gain. At press time, BNB traded near its immediate resistance line at $479 and registered a 0.61% loss over the last 24 hours.
After trading at its six-week high on 22 October, the bears showed some resistance as the altcoin saw a minor pullback. If the bears continue to show resistance, they may find strong support at $410.
The Relative Strength Index (RSI) suggested a decreasing buying strength as it stood below the half-line and seemed to head south. Also, the MACD was below the signal line, affirming the bearish vigor.
However, the Squeeze Momentum Indicator flashed black dots and dark red bars while it marched towards the zero line, possibly indicating a squeeze phase.
XRP

Source: TradingView, XRP/USDT
XRP saw a decline of around 4% over the last week. The altcoin oscillated within a triangular range with decreasing highs, starting from its resistance point at $1.2260 until the $1.07-mark. At press time, XRP traded at $1.0864 and flashed bearish signals.
The trading price was below the 20-SMA (red) and 50-SMA (orange), suggesting a preference for selling strength. If the selling pressure continues, the bears can aim to find new support at the $1.04-mark. The RSI remained well under the midline at the 41-mark.
Additionally, the MACD histogram displayed a preference for sellers as it remained below the zero line. However, the Squeeze Momentum Indicator flashed black dots and dark red bars while it marched towards the zero line, possibly indicating a squeeze phase.
Tron (TRX)
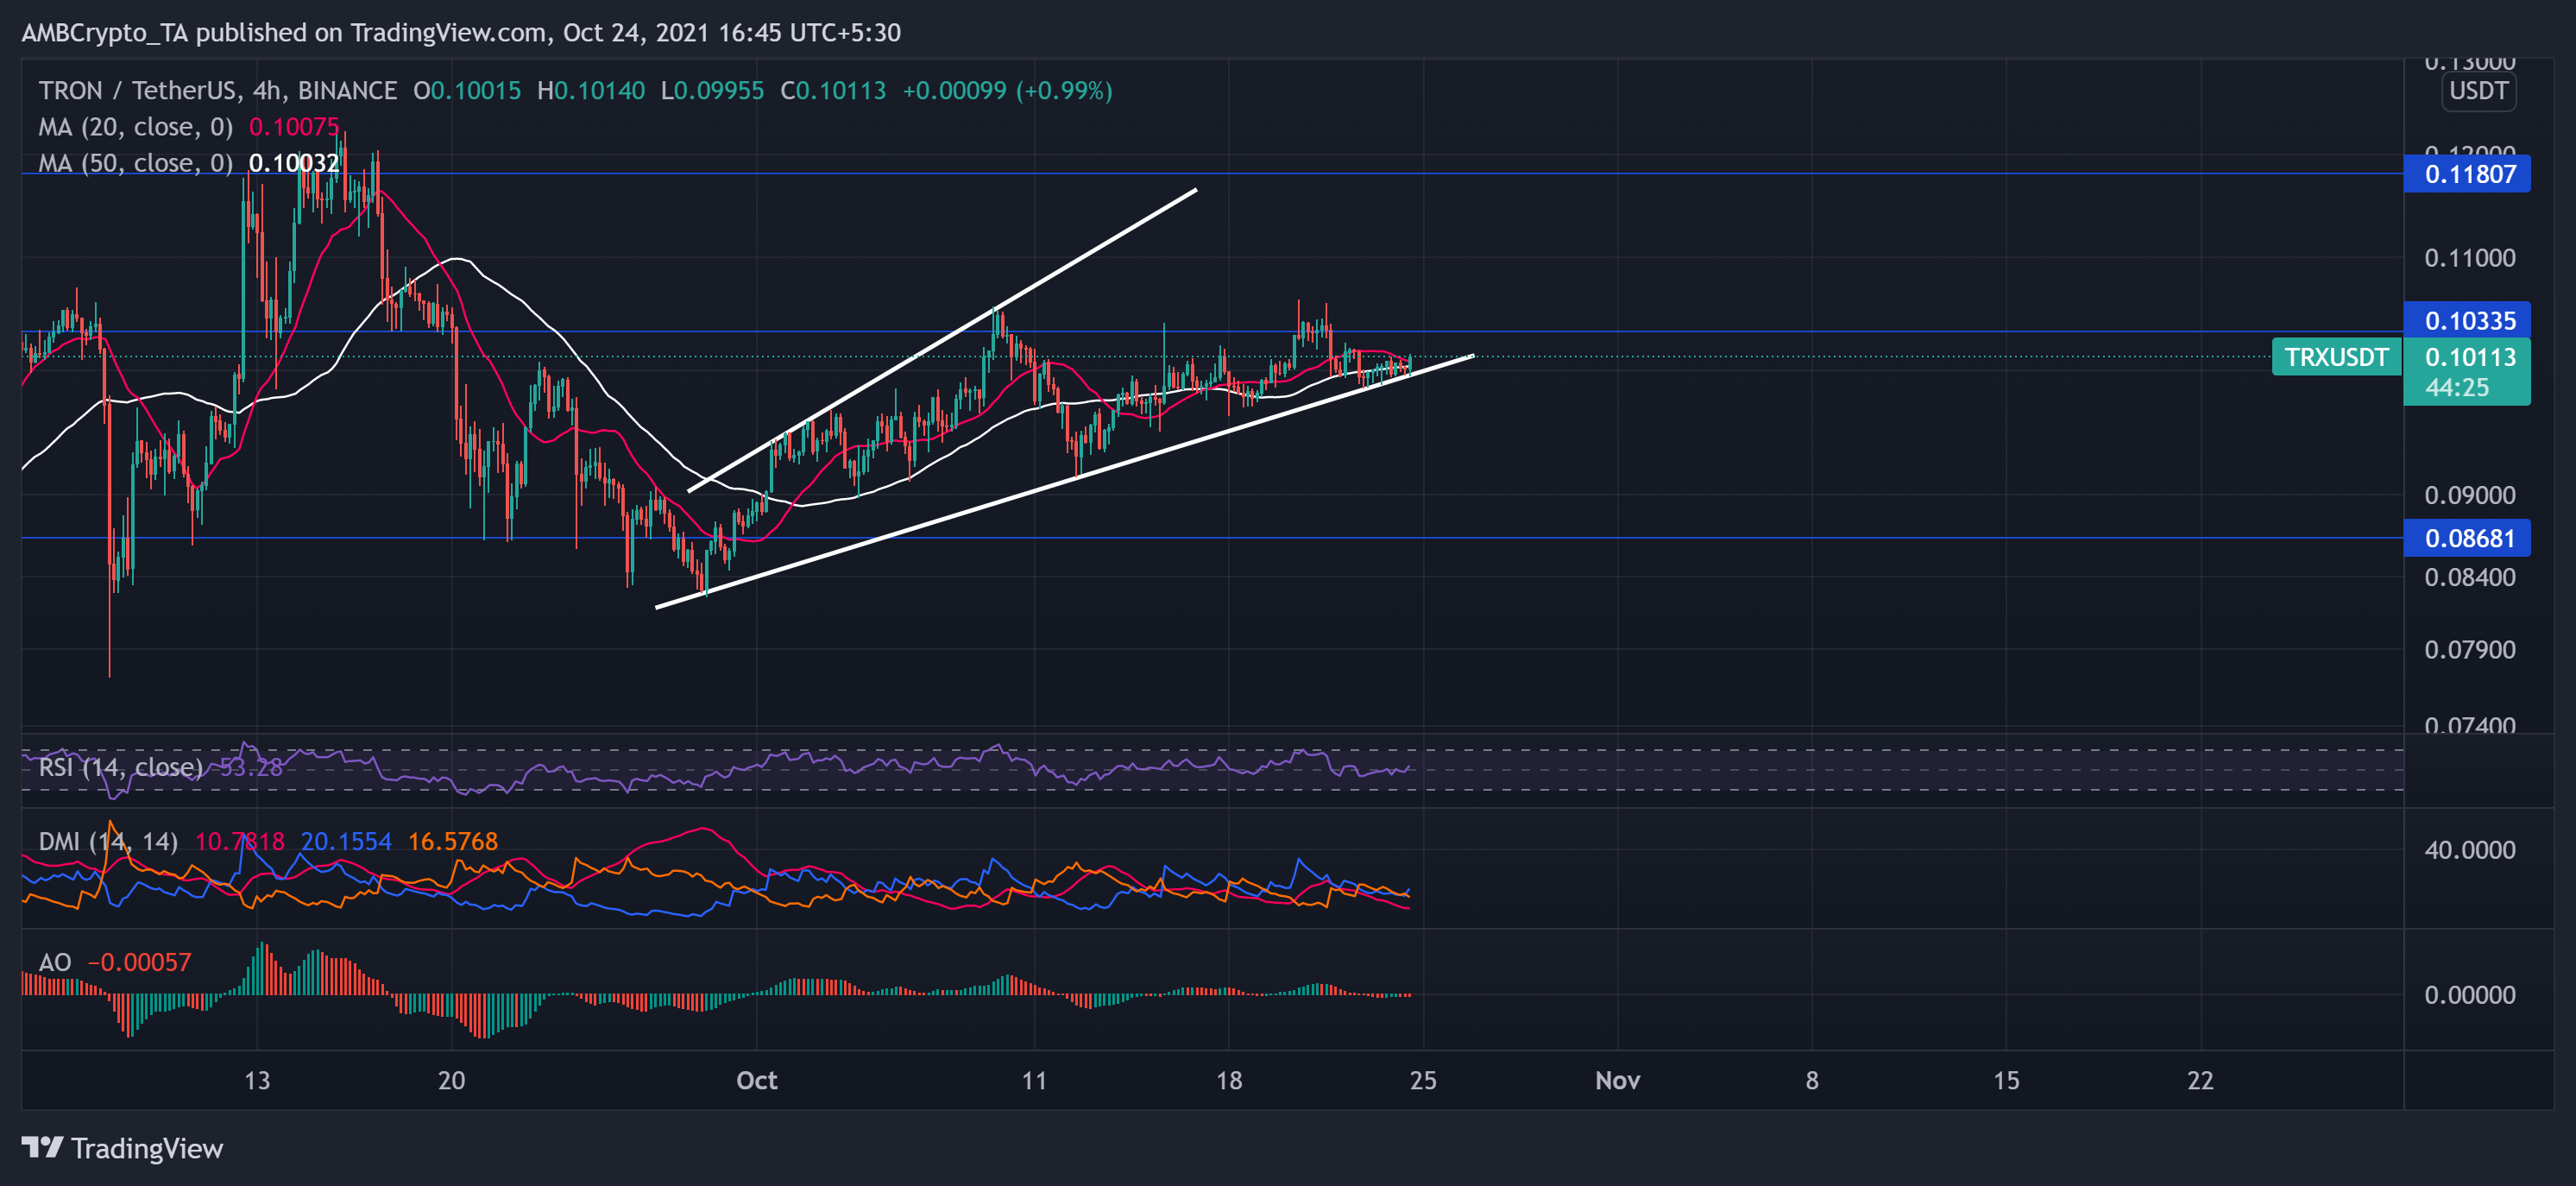
TradingView, TRX/USDT
The altcoin traded at $0.101 and noted a 2.06% gain on its charts over the last day. Over the past month, TRX fluctuated in an uptrend, as displayed by the higher highs marked on its trendline. TRX bulls exerted constant pressure as the bears showed resistance at $0.103.
If the bears fail to keep up their pressure, the bulls can aim at a higher resistance of $0.118. Key technicals hinted at increasing buying strength in the near term.
The RSI stood above the half-line, while the +DI line seemed to head north. However, The Awesome Oscillator flashed some red signal bars, and also the ADX line displayed a weak directional trend.