Binance Coin’s [BNB] bearish breakout shows $300 is the next target
The bulls failed to drive a rally from the $320-$325 region and the bears took the driving seat and looked to drive Binance Coin back to the $300 support
![Binance Coin's [BNB] bearish breakout shows $300 is the next target](https://ambcrypto.com/wp-content/uploads/2023/05/PP-2-BNB-cover-e1683702817284.jpeg)
Disclaimer: The information presented does not constitute financial, investment, trading, or other types of advice and is solely the writer’s opinion.
- The lower timeframe bias was strongly bearish.
- The pattern breakout showed that BNB was likely to drop to $300.
Bitcoin [BTC] fell below the $27.8k level of support and has retested it as resistance over the past two days. This was accompanied by Binance Coin [BNB] prices diving on the price charts, with further losses anticipated.
Is your portfolio green? Check the Binance Coin Profit Calculator
The bearish breakout beneath the triangle pattern meant that Binance Coin traders can anticipate further losses in the coming days. The psychologically important level of $300 could be tested as support.
Failure of trendline support hinted at a downward move
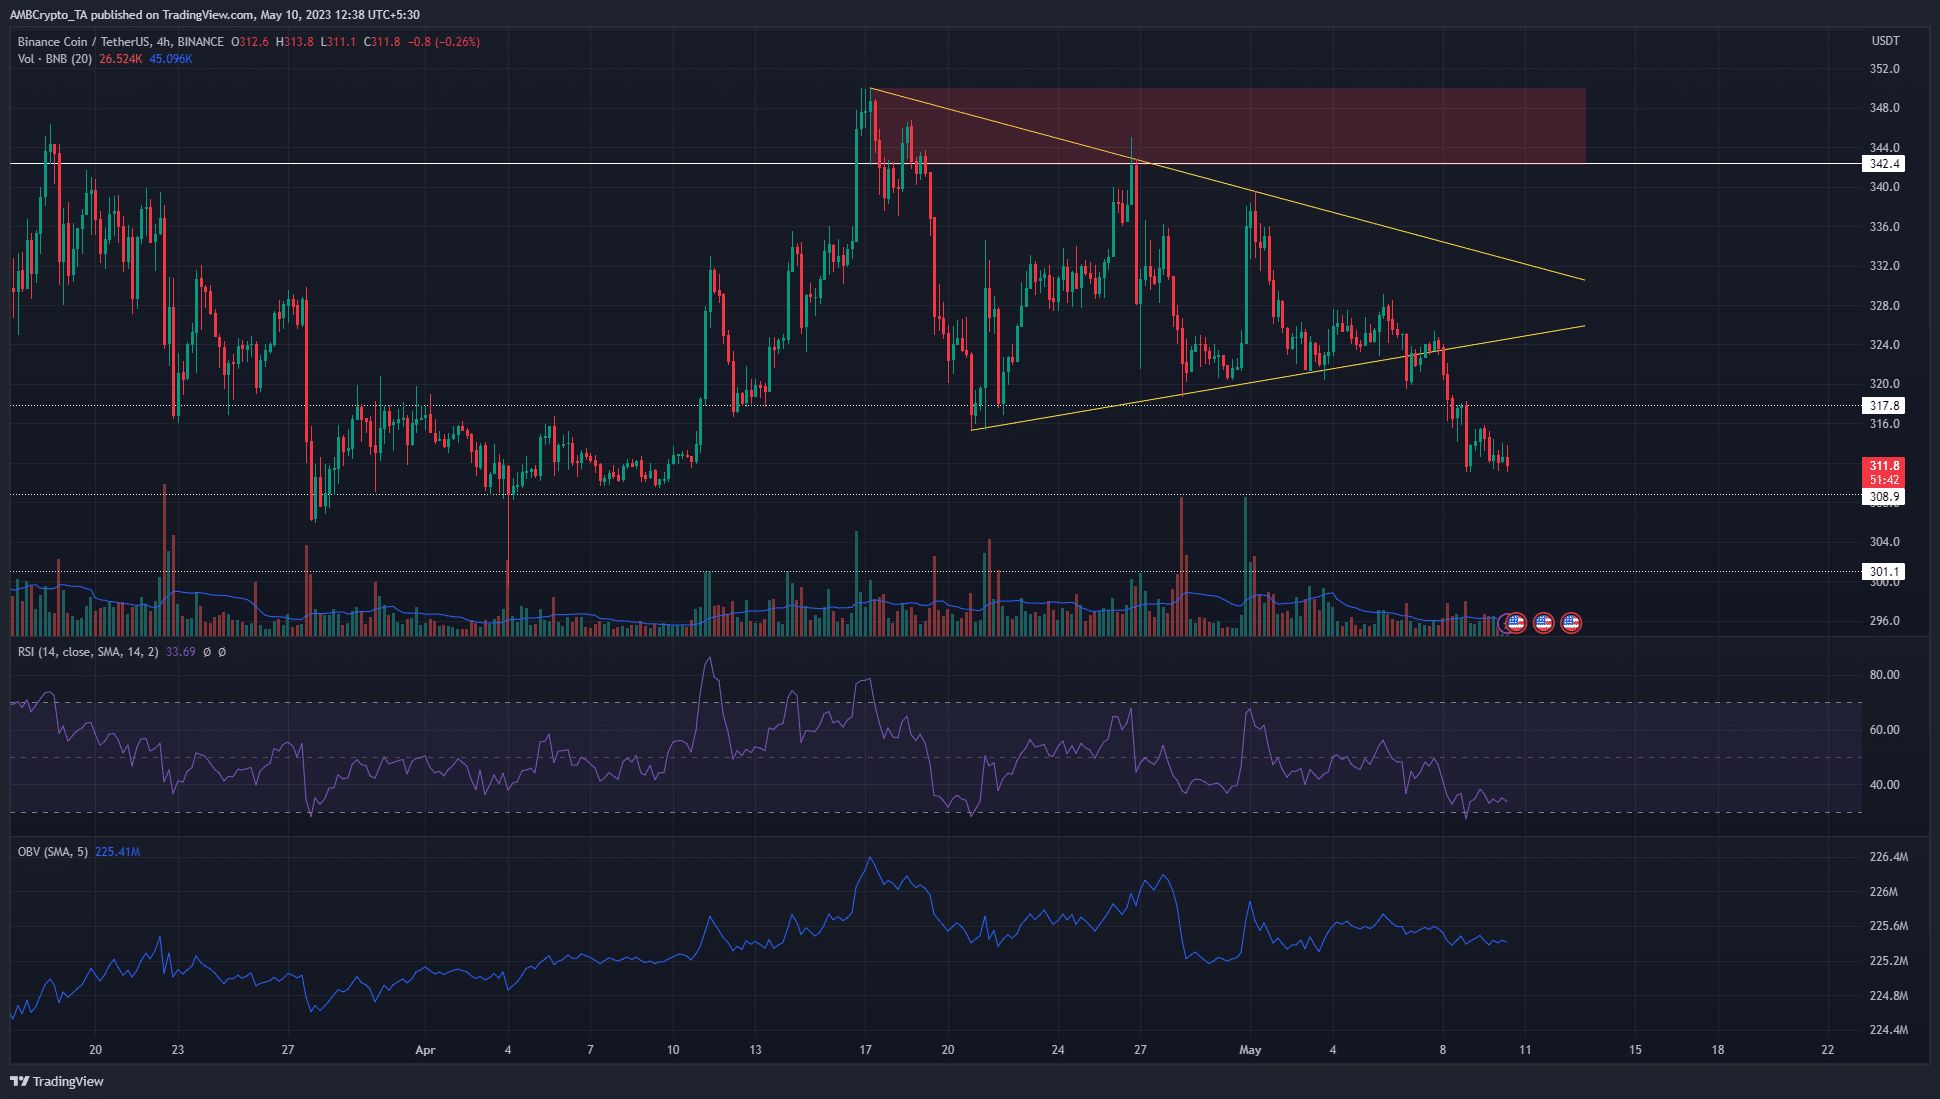
Since its mid-April surge to $350, Binance Coin has oscillated between the $320 and $340 areas. The past three weeks of trading showed BNB that it has formed a symmetrical triangle pattern (yellow). Over the past few days, the lower trendline support was broken and retested by the price.
This showed that bears had the upper hand, and it was followed by a quick descent from $324 to $311. The move represented losses of 4.39% within 32 hours. To the south, the $309 and $301 are levels of support that have been important since February.
The RSI was beneath neutral 50 and showed strong downward momentum. Meanwhile, the OBV was inching lower in May, underlining that sellers had a slight edge over the buyers.
On higher timeframes, the $300-$315 region was a strong demand zone. Hence, short-sellers should be wary of sudden short-term rallies. A rising OBV could warn BNB traders of an impending bounce.
The Open Interest chart showed discouraged bulls
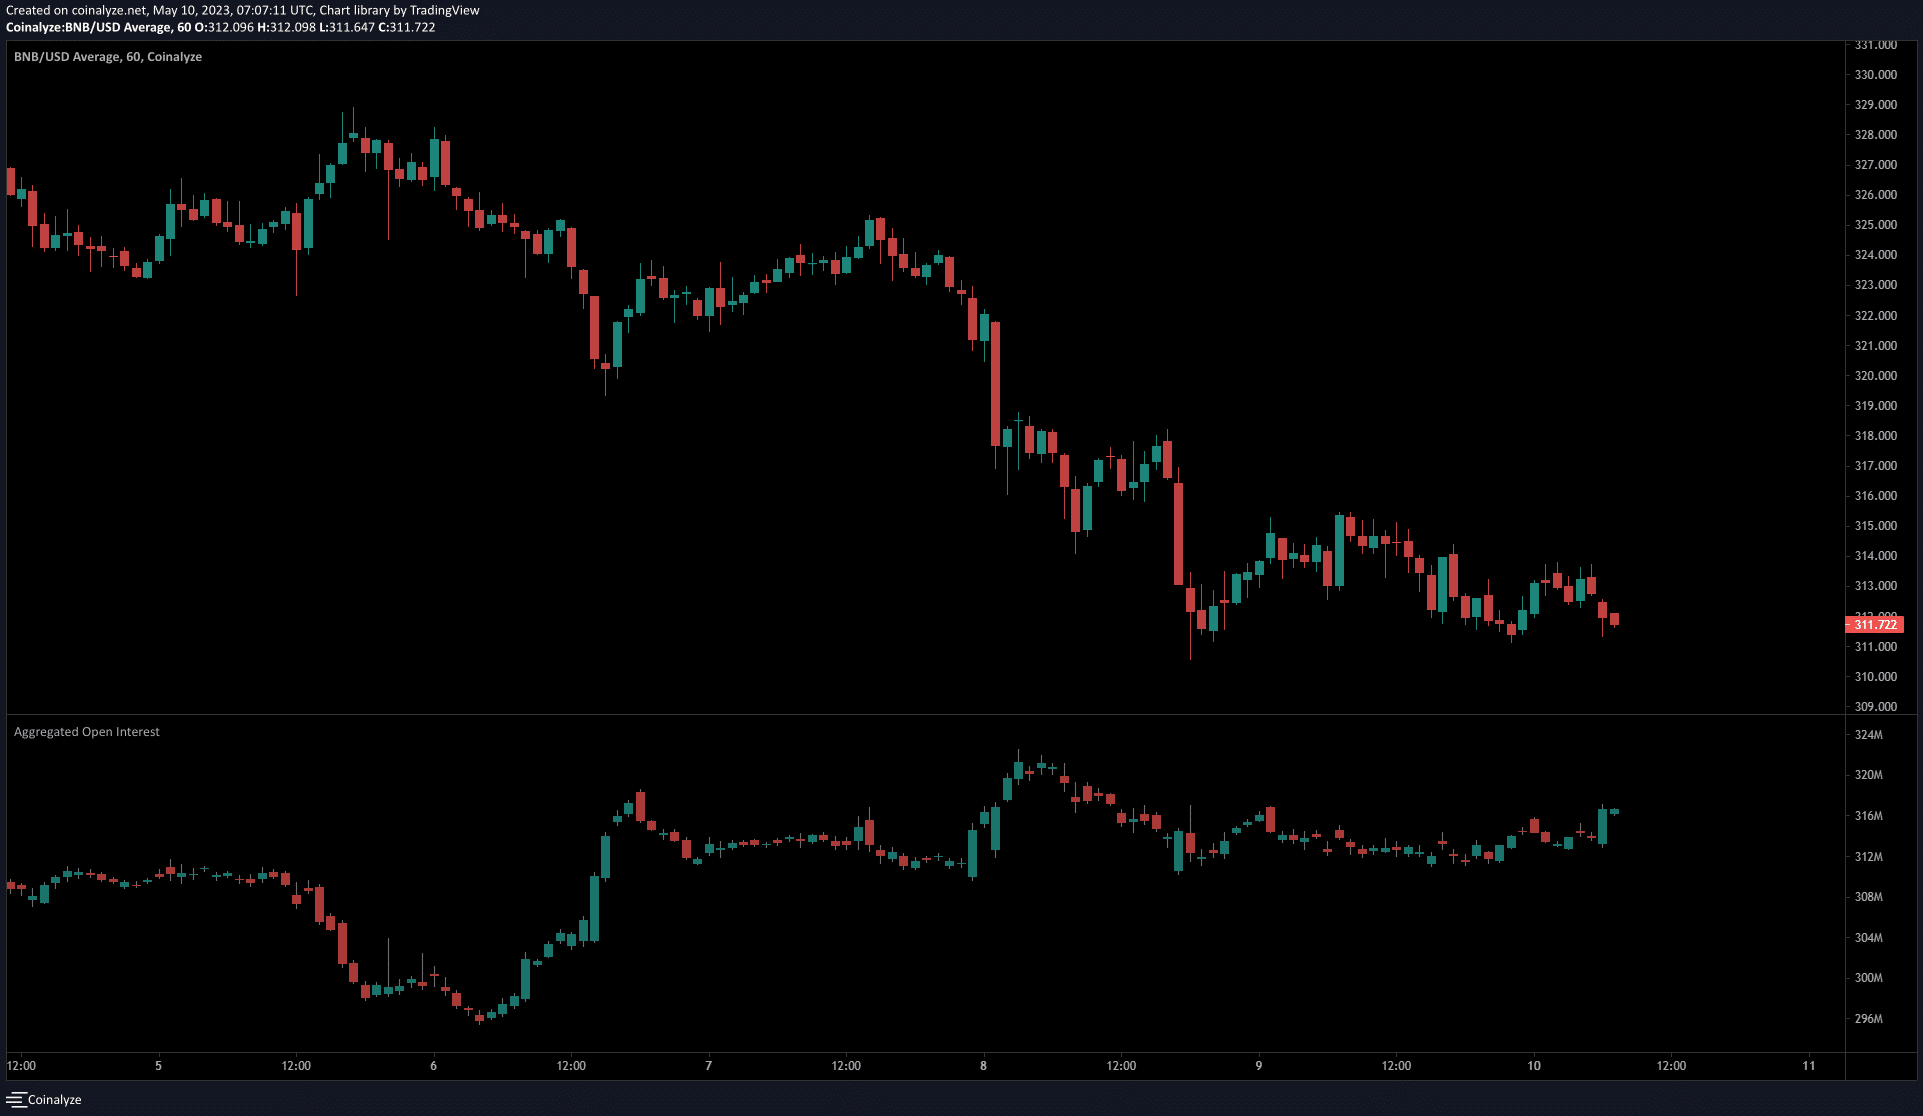
On 8 May the Open Interest surged higher by close to $6 million. During that time Binance Coin fell from $324 to $316, which showed speculators were shorting the asset in large numbers.
Realistic or not, here’s BNB’s market cap in BTC’s terms
This reinforced the idea that the breakdown beneath the triangle fed the bearish momentum. Coinglass Liquidation Data showed Binance Coin saw a large number of long positions liquidated on 8 May.
In the past two days, the Open Interest has been flat while prices continued to slump. The trading session in the two hours before the time of writing saw rising OI alongside falling prices again. Hence bears are likely to drive the prices to $308 and $301 within this week.


