
Following the release of the September Inflation Report Data that showed that the consumer price index (CPI) rose 8.2% in September on a 12-month basis, the cryptocurrency market was hit momentarily by severe volatility.
The price of the leading coin Bitcoin [BTC] had seen low volatility in the past few weeks as investors attempted to establish a bear market floor.
However, immediately following the release of the Inflation Report Data, the king coin suffered some price volatility, and its price fell below the $19,000 mark to exchange hands briefly at $18,300.
According to data from blockchain analytics platform Santiment, this decline represented BTC’s lowest price level since 21 September and was foisted upon the market due to panic selling by “weak hands.”
? Thursday has been an expectedly volatile day after inflation data was released. #Bitcoin dropped to $18.3k, its lowest price level since September 21st. However, as traders were in the midst of stopping the bleeding, $BTC & the #SP500 rapidly recovered. https://t.co/SoJXb4JaVz pic.twitter.com/OSk7fECOMw
— Santiment (@santimentfeed) October 13, 2022
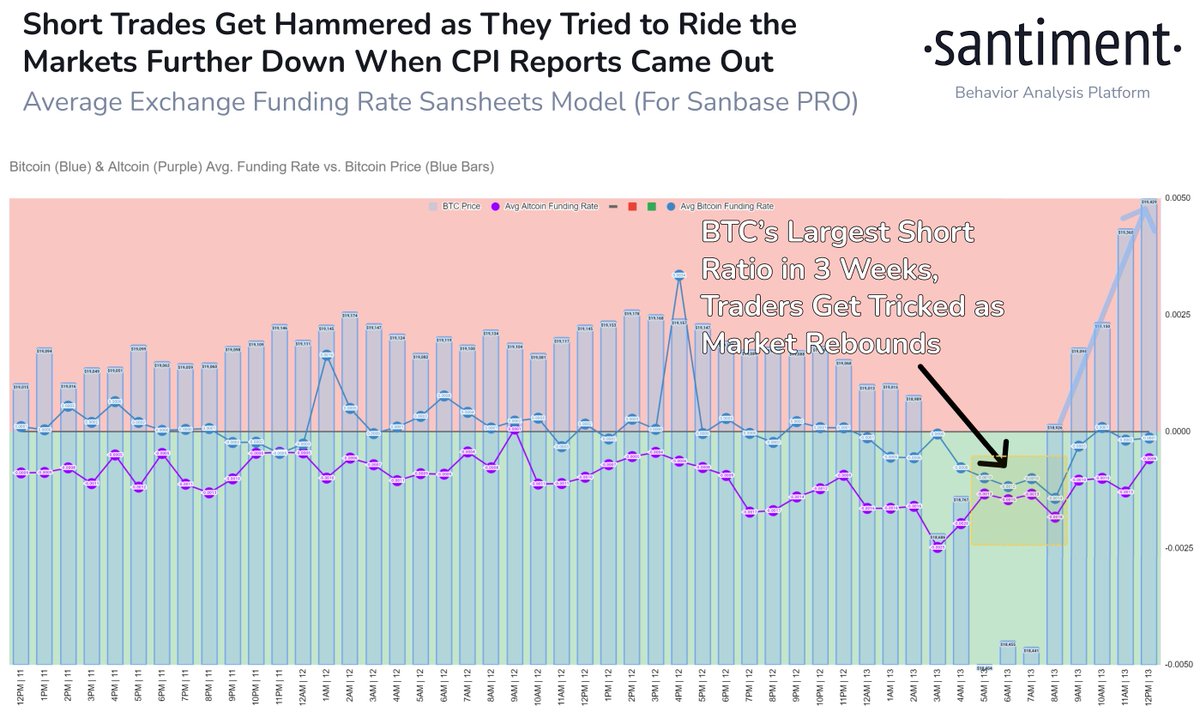
BTC’s price, however, rebounded almost immediately to regain its position at the $19,000 mark, plunging BTC short traders into losses.
Per data from Santiment, traders had shorted BTC and some other altcoins severely as soon as the news broke in the expectation that their prices would decline.
However, as soon as BTC hit a 3-week high short vs. long exchange ratio, its price stopped declining and regained its spot at the $19,000 mark, leading many who bet against it to get liquidated.
Source: Santiment
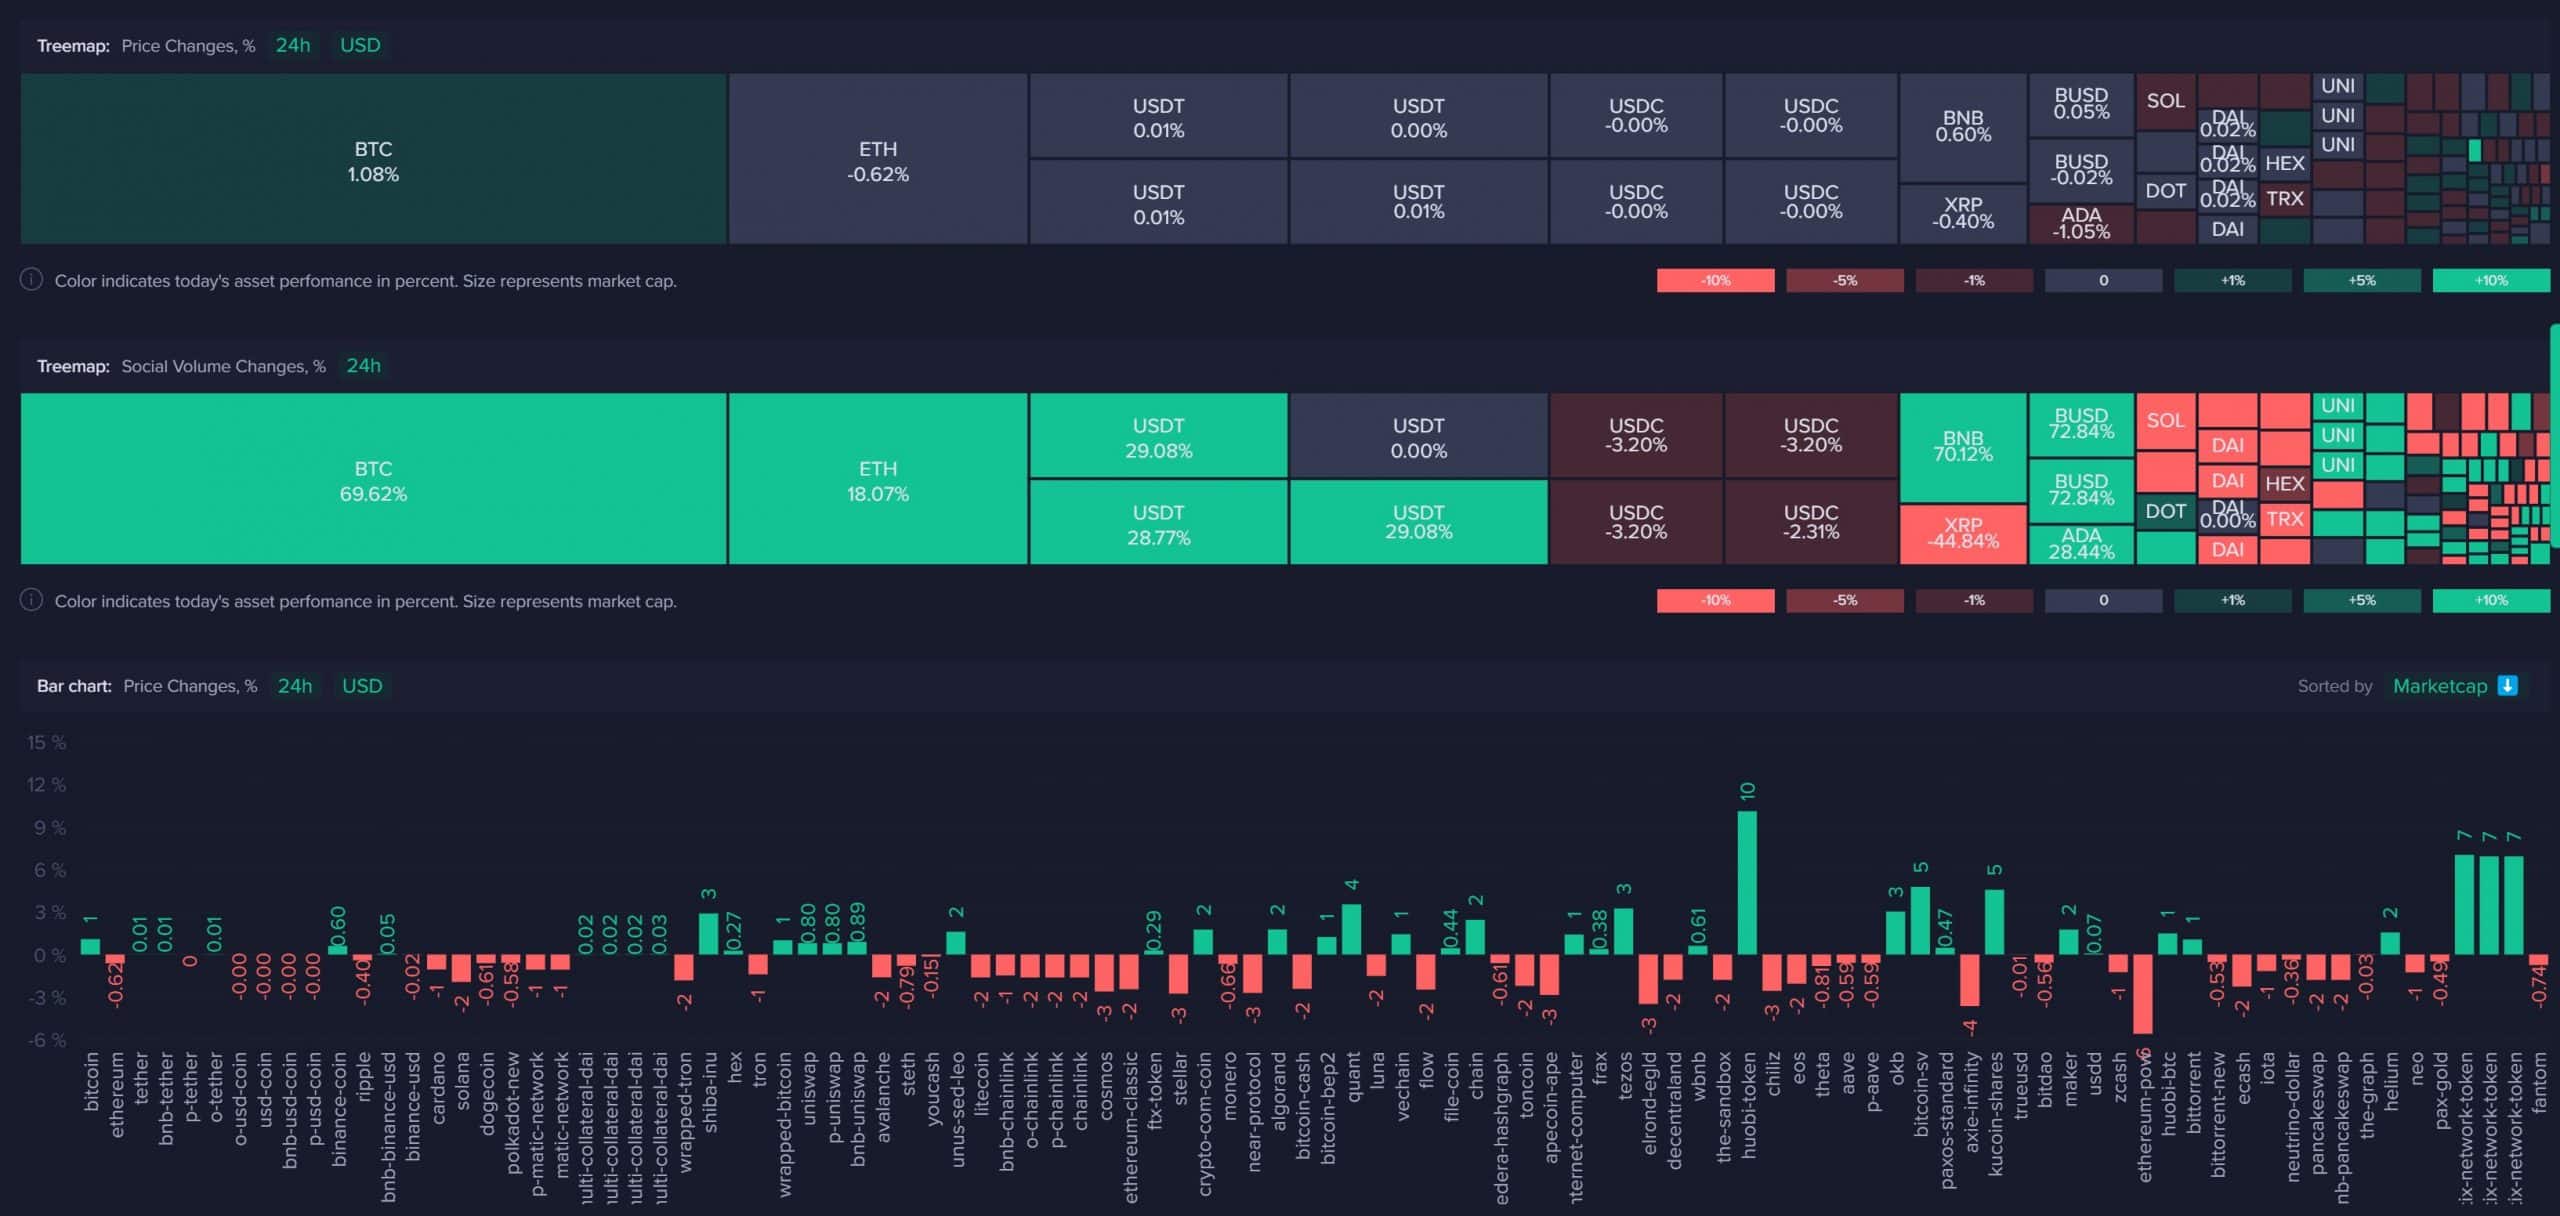
To the surprise of many, BTC’s market capitalization grew slightly amid the volatility that hit the market on 13 October.
According to data from CoinMarketCap, the asset’s market capitalization rallied by 4% in the last 24 hours.
Interestingly, the social volume of top cryptocurrency assets also rallied following the release of the inflation report on 13 October, data from Santiment revealed.
Source: Santiment
The king coin in the last 24 hours
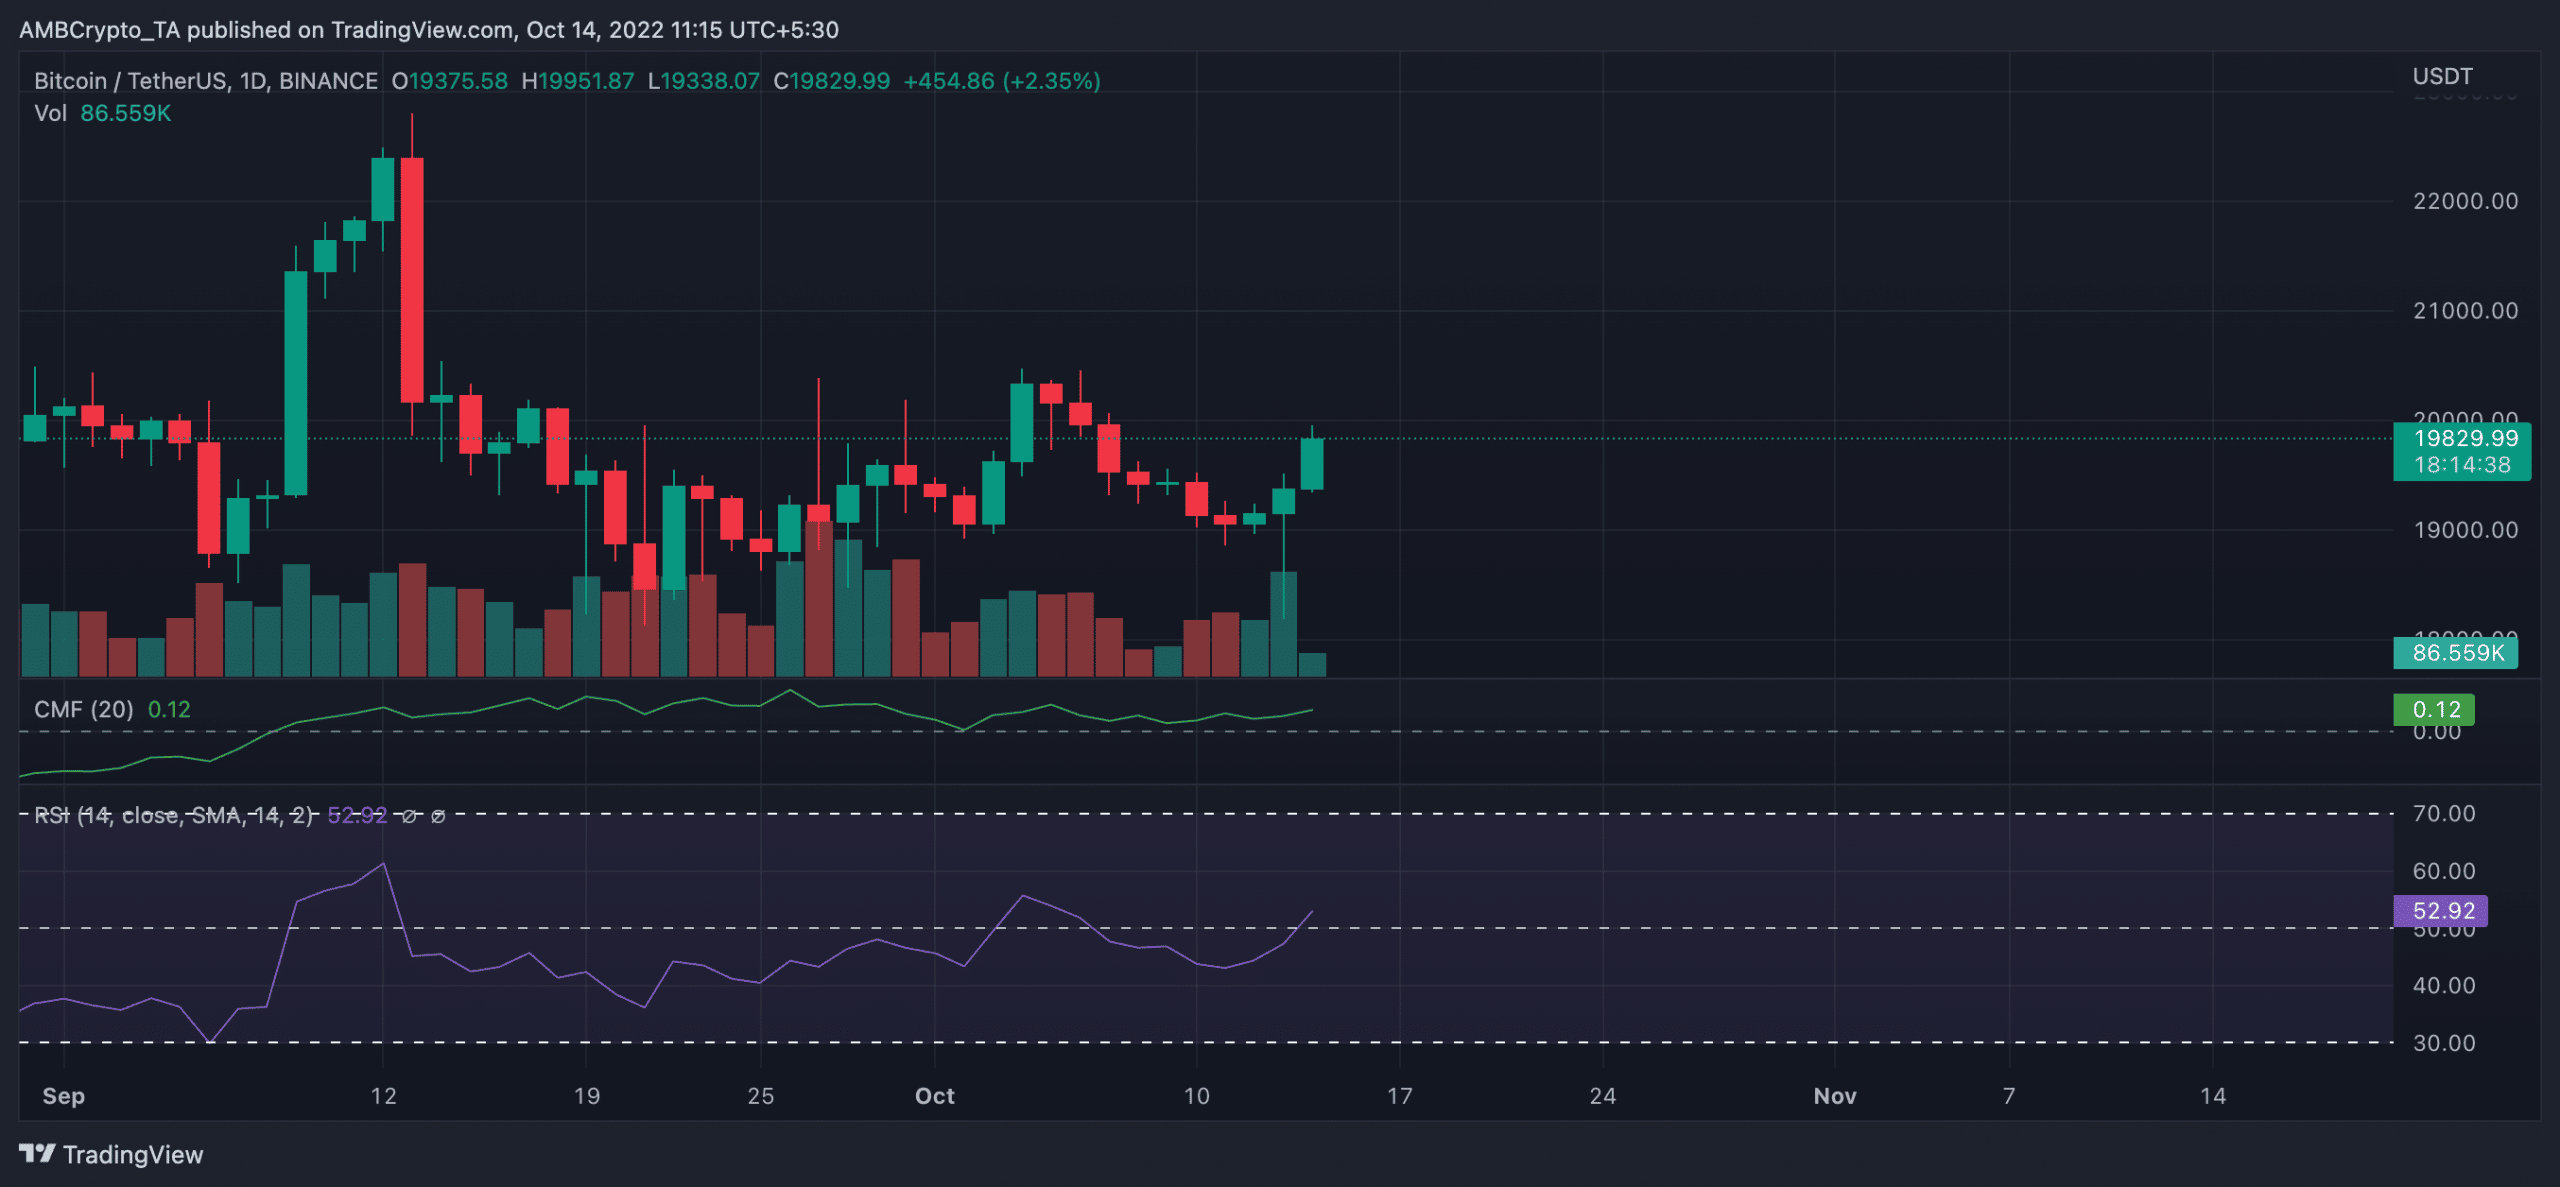
Even so, there was a 4% rally in the price of BTC in the past 24 hours. With increased trading ongoing at press time, trading volume was up by 96%, as of this writing.
The last 24 hours have been marked by a rally in the buying pressure for the leading asset. The rally in BTC’s price following the momentary decline suffered on 13 October pushed its Relative Strength Index (RSI) above the 50-neutral line on a daily chart. On an uptrend at press time, the RSI was 52.92.
Also hinting at a significant buying pressure for BTC in the last 24 hours, the dynamic line (green) of its Chaikin Money Flow (CMF) rested above the center line (red) at 0.12. This indicated an increasing volume of coin accumulation.
Source: TradingView


![Three days ago, Uniswap [UNI] attempted a breakout from a parallel channel, surging to hit a local high of $7.6. However, the altcoin faced strong rejection.](https://ambcrypto.com/wp-content/uploads/2025/06/Gladys-83-400x240.jpg)

