Bitcoin: Assessing the possibility of this bull cycle trend repeating itself

With November only one week away and Bitcoin taking a dip under the $60k level on 27 October, bears seem to be dictating the market trend. At least in the short term. In fact, after a power-packed ‘Uptober,’ expectations of some consolidation from Bitcoin in the coming month have risen.
Nonetheless, with the king coin trading at $61,021 at press time, it is important to analyze the market on a more structural level to assess BTC’s path ahead.
Metrics still looking good
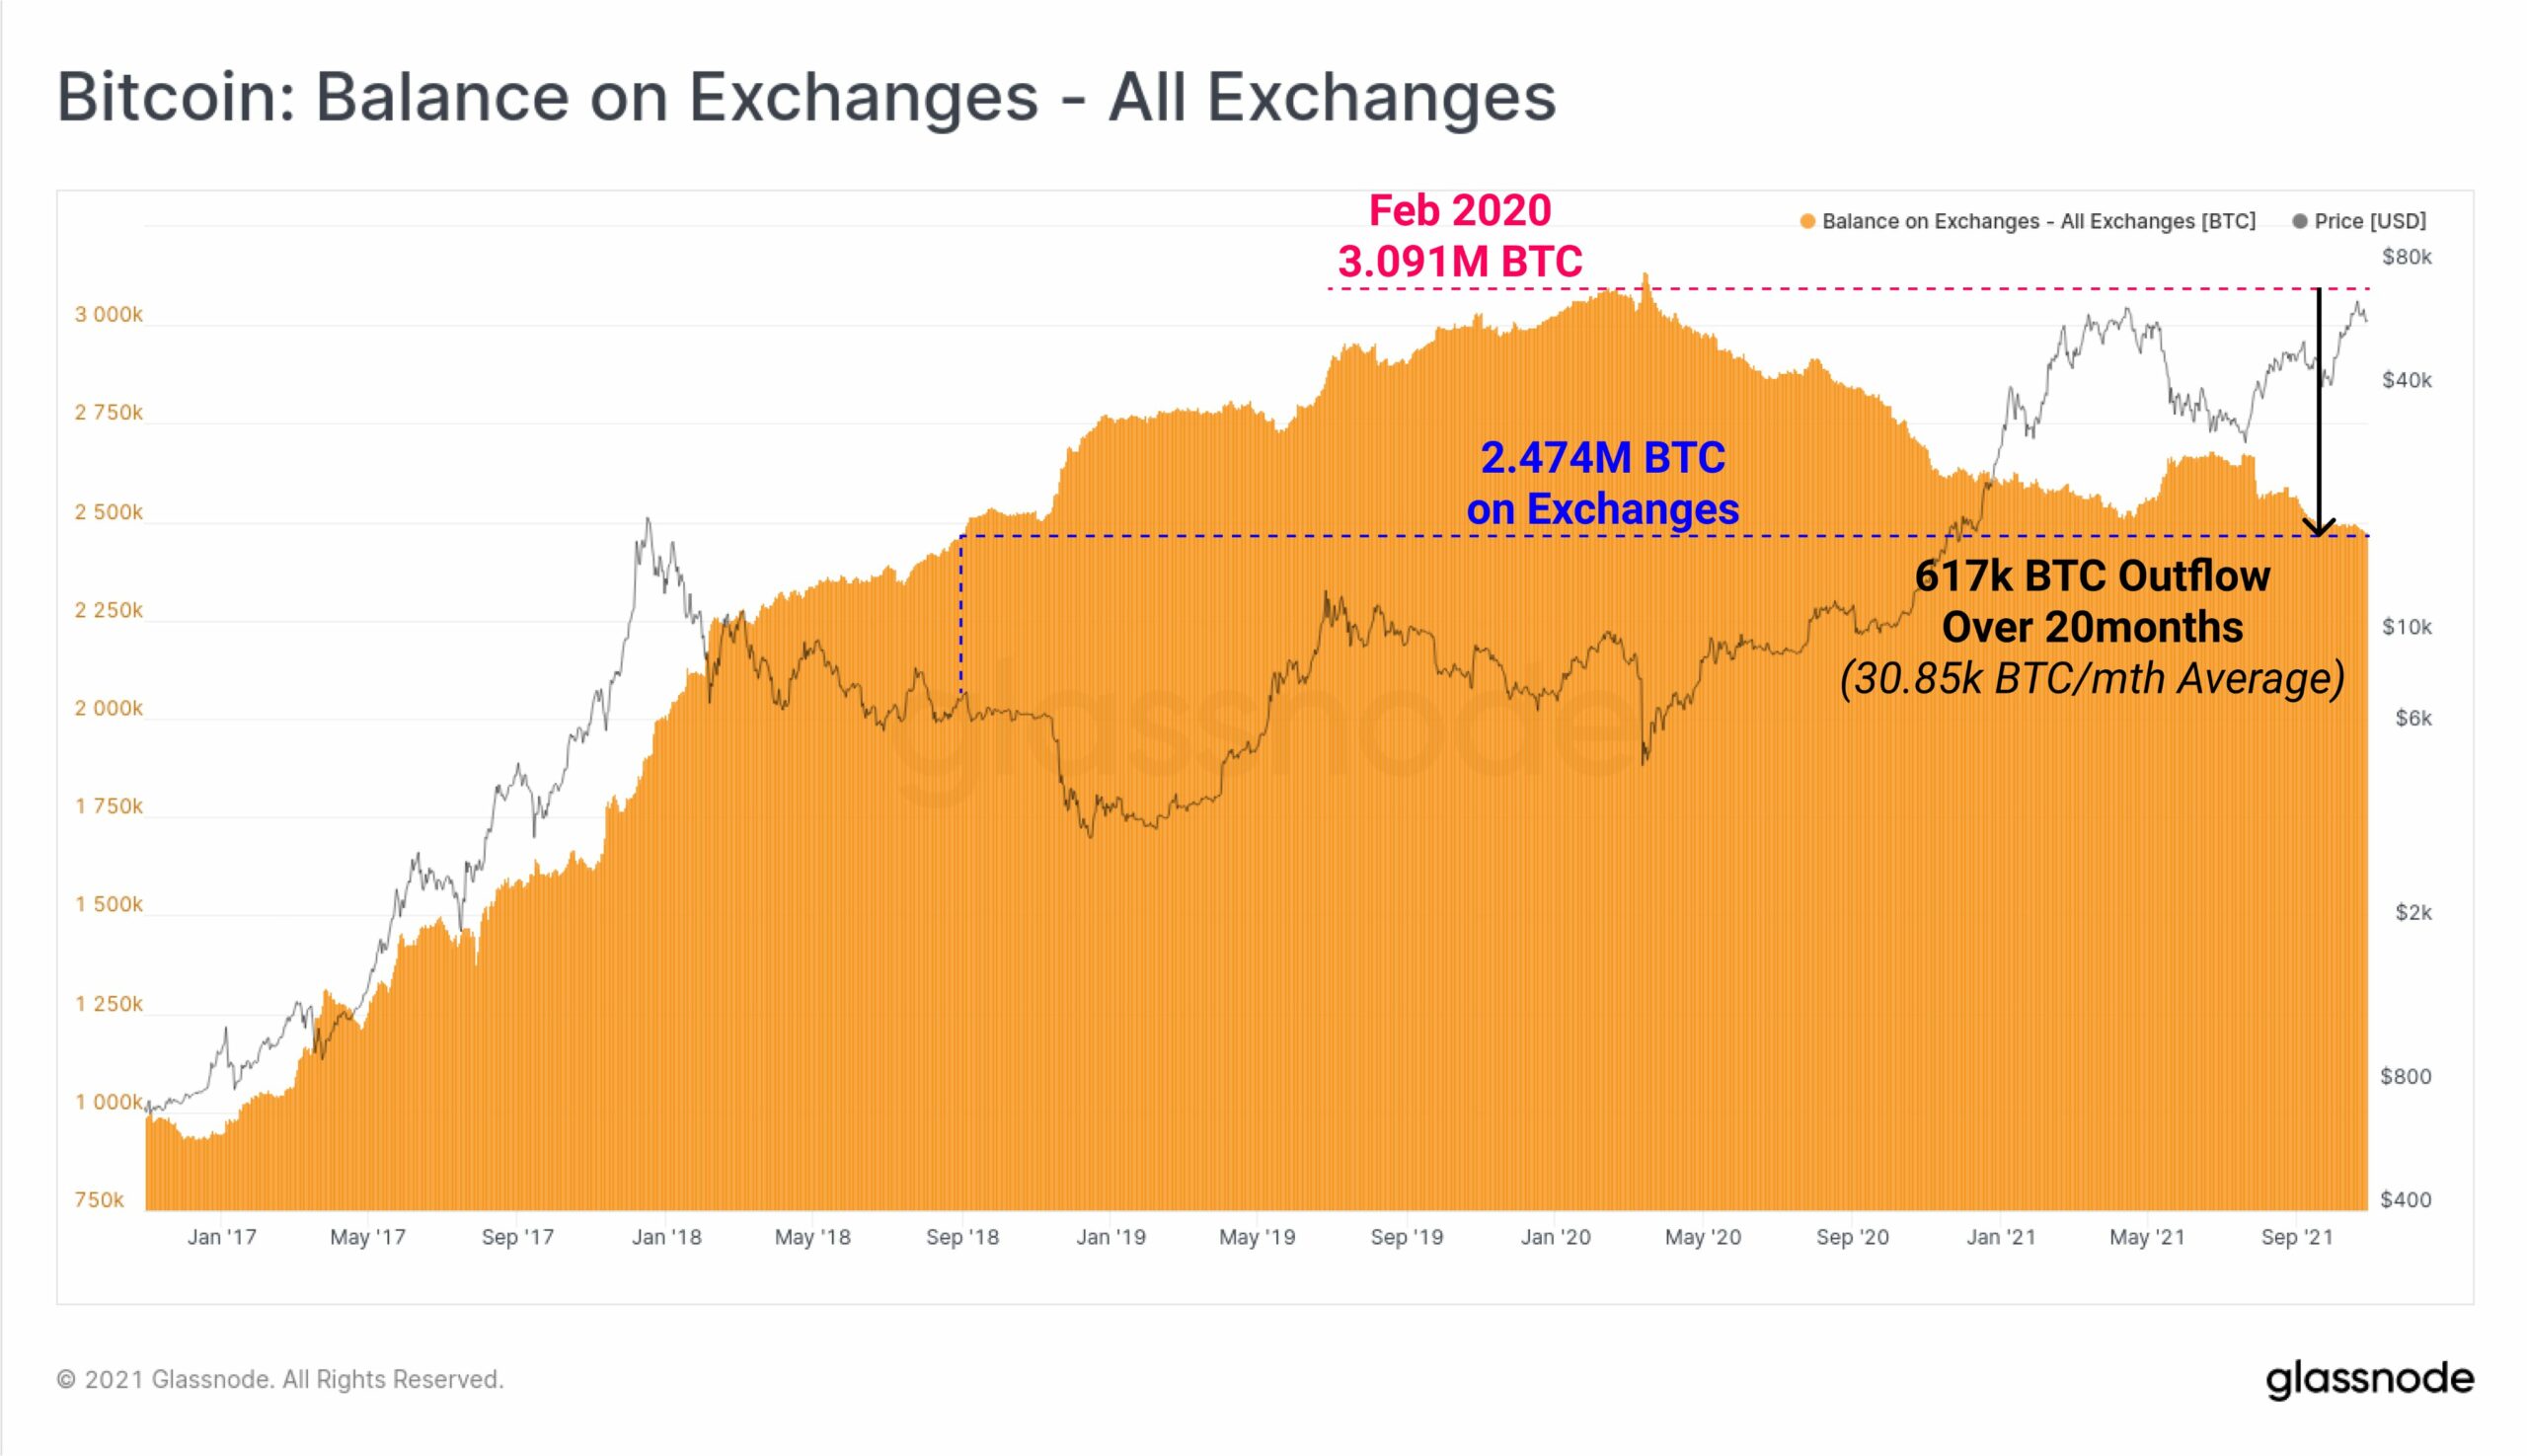
In spite of the minor pullback in prices, the Bitcoin balance held on exchanges has continued to decline this week too. Balances fell to 2.474 million BTC, returning to levels last seen in August 2018. Notably, since February 2020, the average rate of outflows has been 30.85K BTC per month.
That being said, the Bitcoin exchange net position change metric also highlighted how persistent the outflows have been this year, with May-July being an exception.
The attached chart, for instance, can be used to see how current outflows are around 22k BTC per month or around 71% of the long-term average.
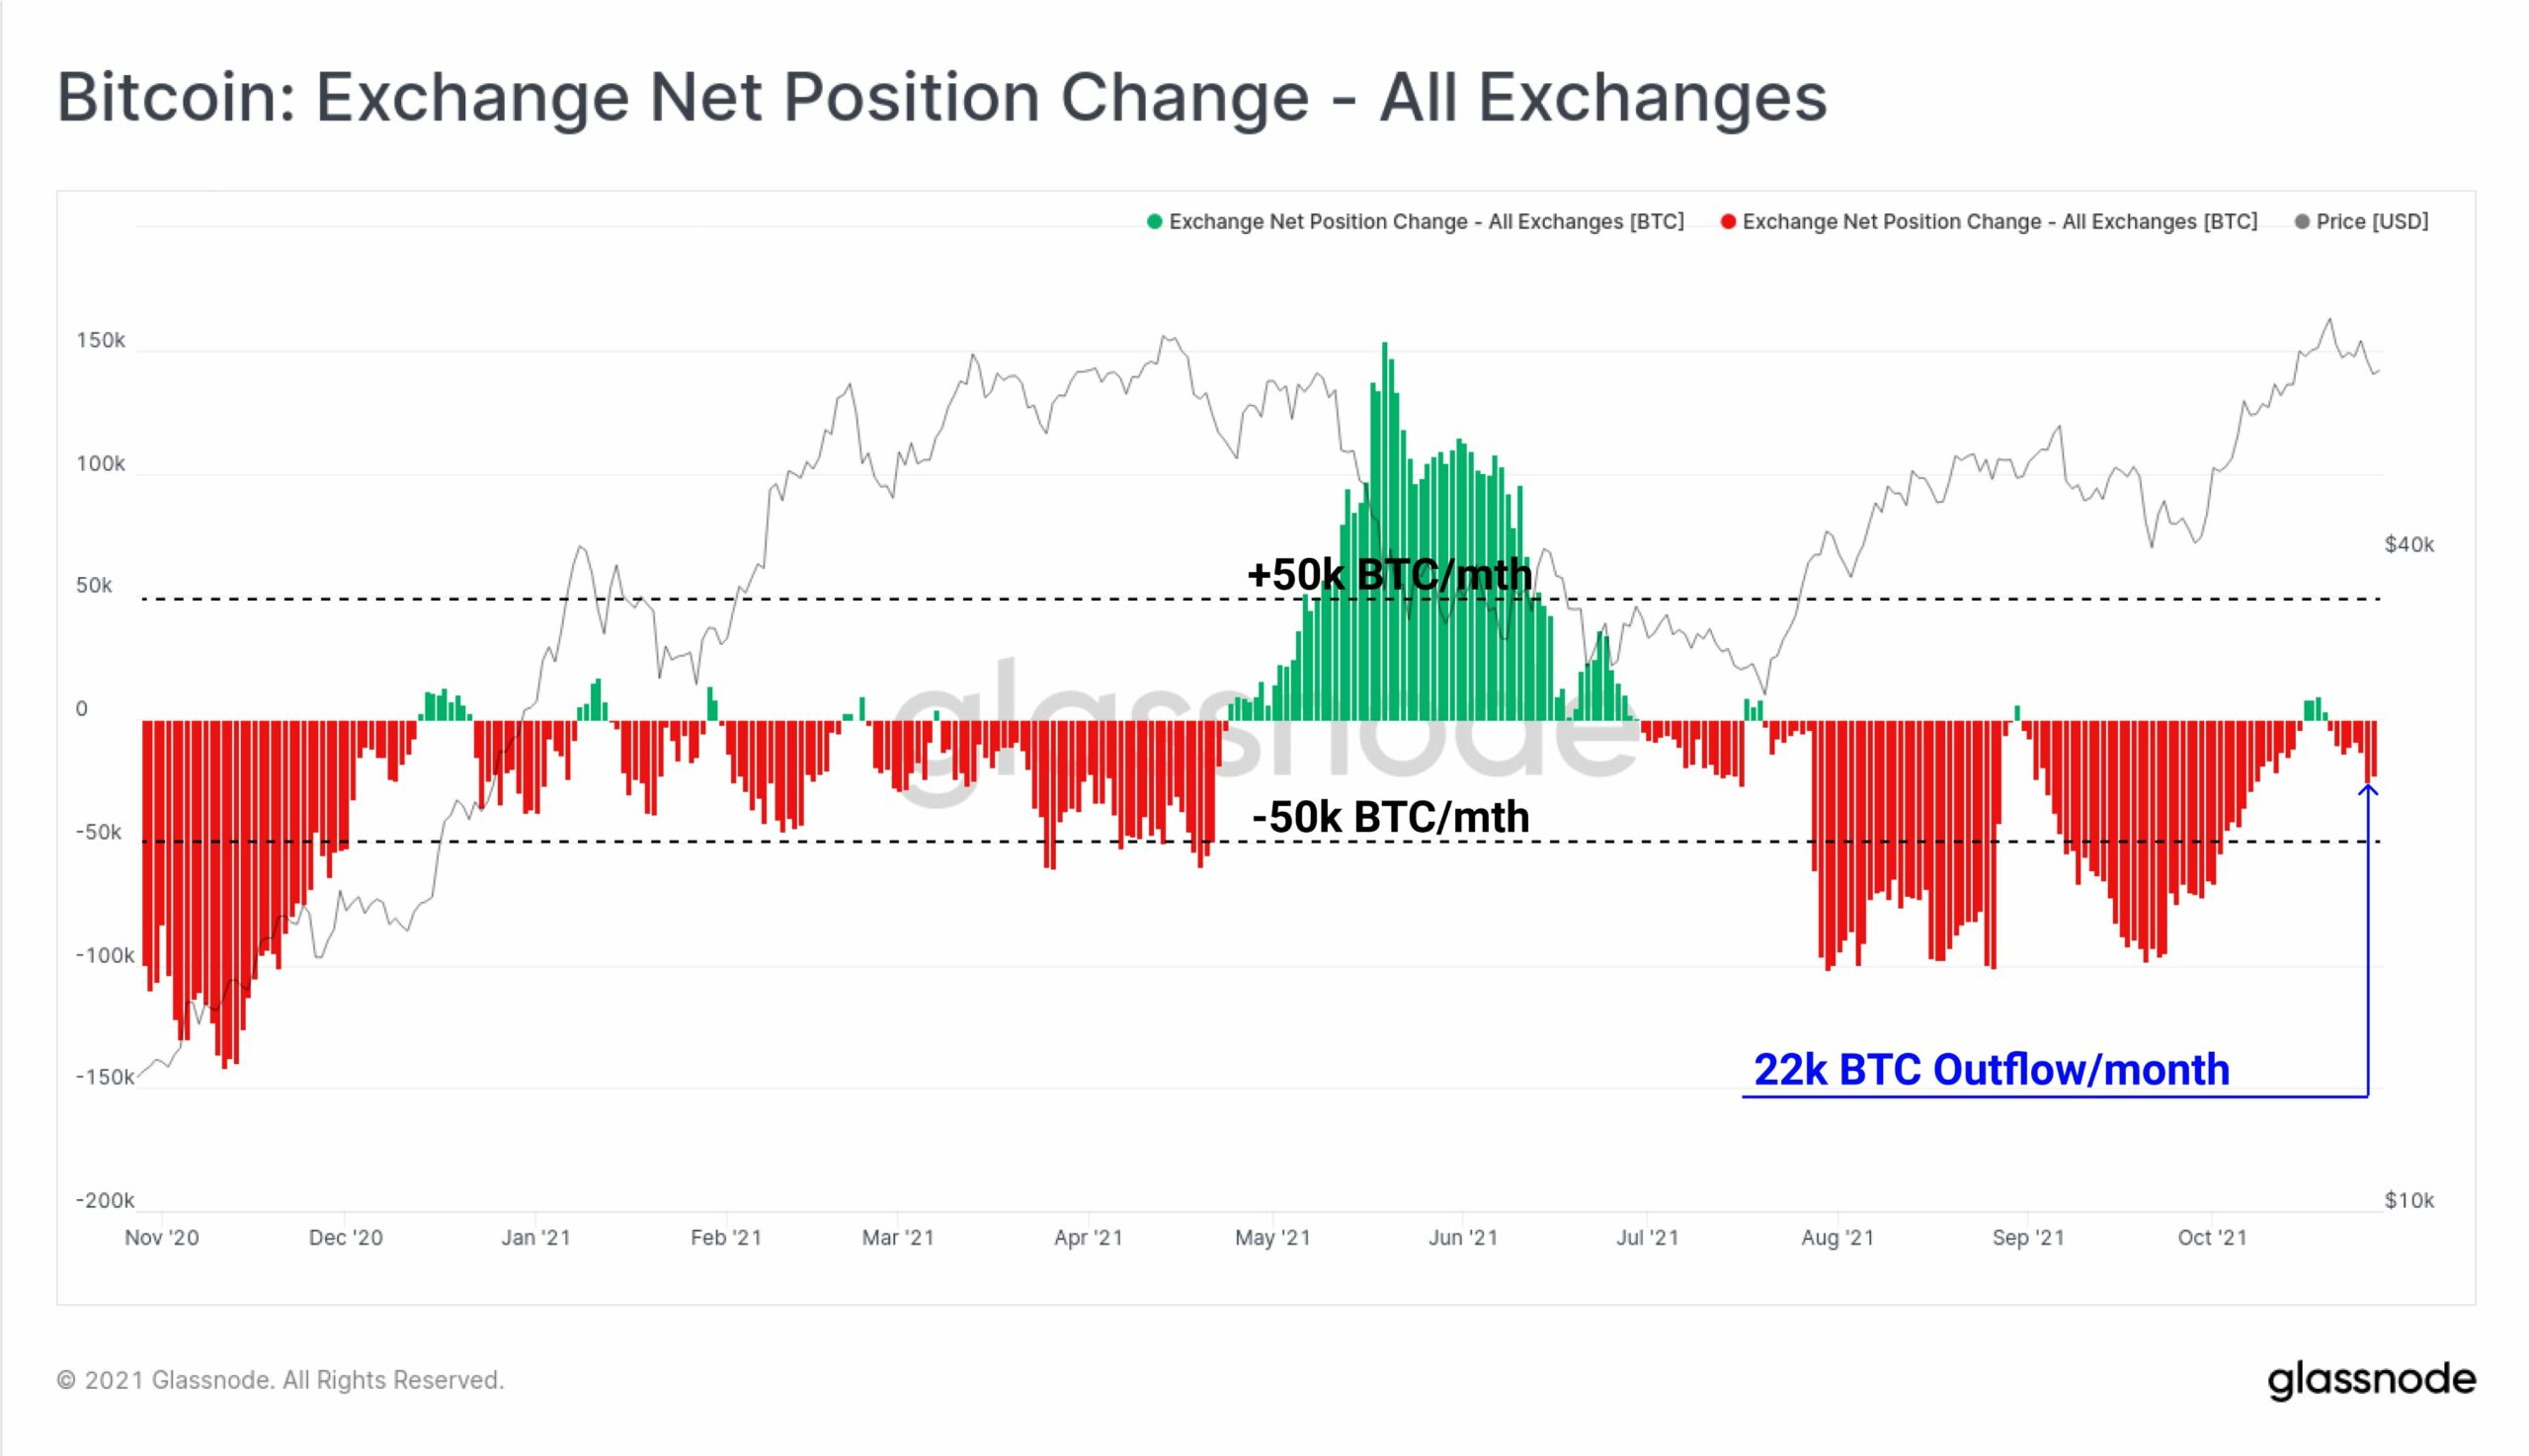
This outflow trend was indicative of collective market conviction, even though the price did see a short-term pullback.
Possibility of repeated market history
Bitcoin’s price momentum hasn’t been predictable, but to some extent, it has followed certain trends that have been maintained over the years. For instance, the gains BTC saw in the month of October highlighted this sustained trend of BTC’s rise as the last quarter begins.
Likewise, the month of November has brought some fruitful outcomes for the king coin in the past.
In 2020, BTC saw close to 45% gains in November, while in 2017, the king coin saw close to 90% gains. But, more than the month, Bitcoin’s trajectory after it breaches a new all-time high is what dictates its trajectory in the following months. Notably, a short-term consolidation trend after a new ATH is reached is particular to BTC’s price momentum.
The 2013 and 2017 cycles saw a similar trajectory wherein 17% and 34% drops were seen in prices, respectively. This time too, after the ATH, a new bear bottom is yet to be defined.
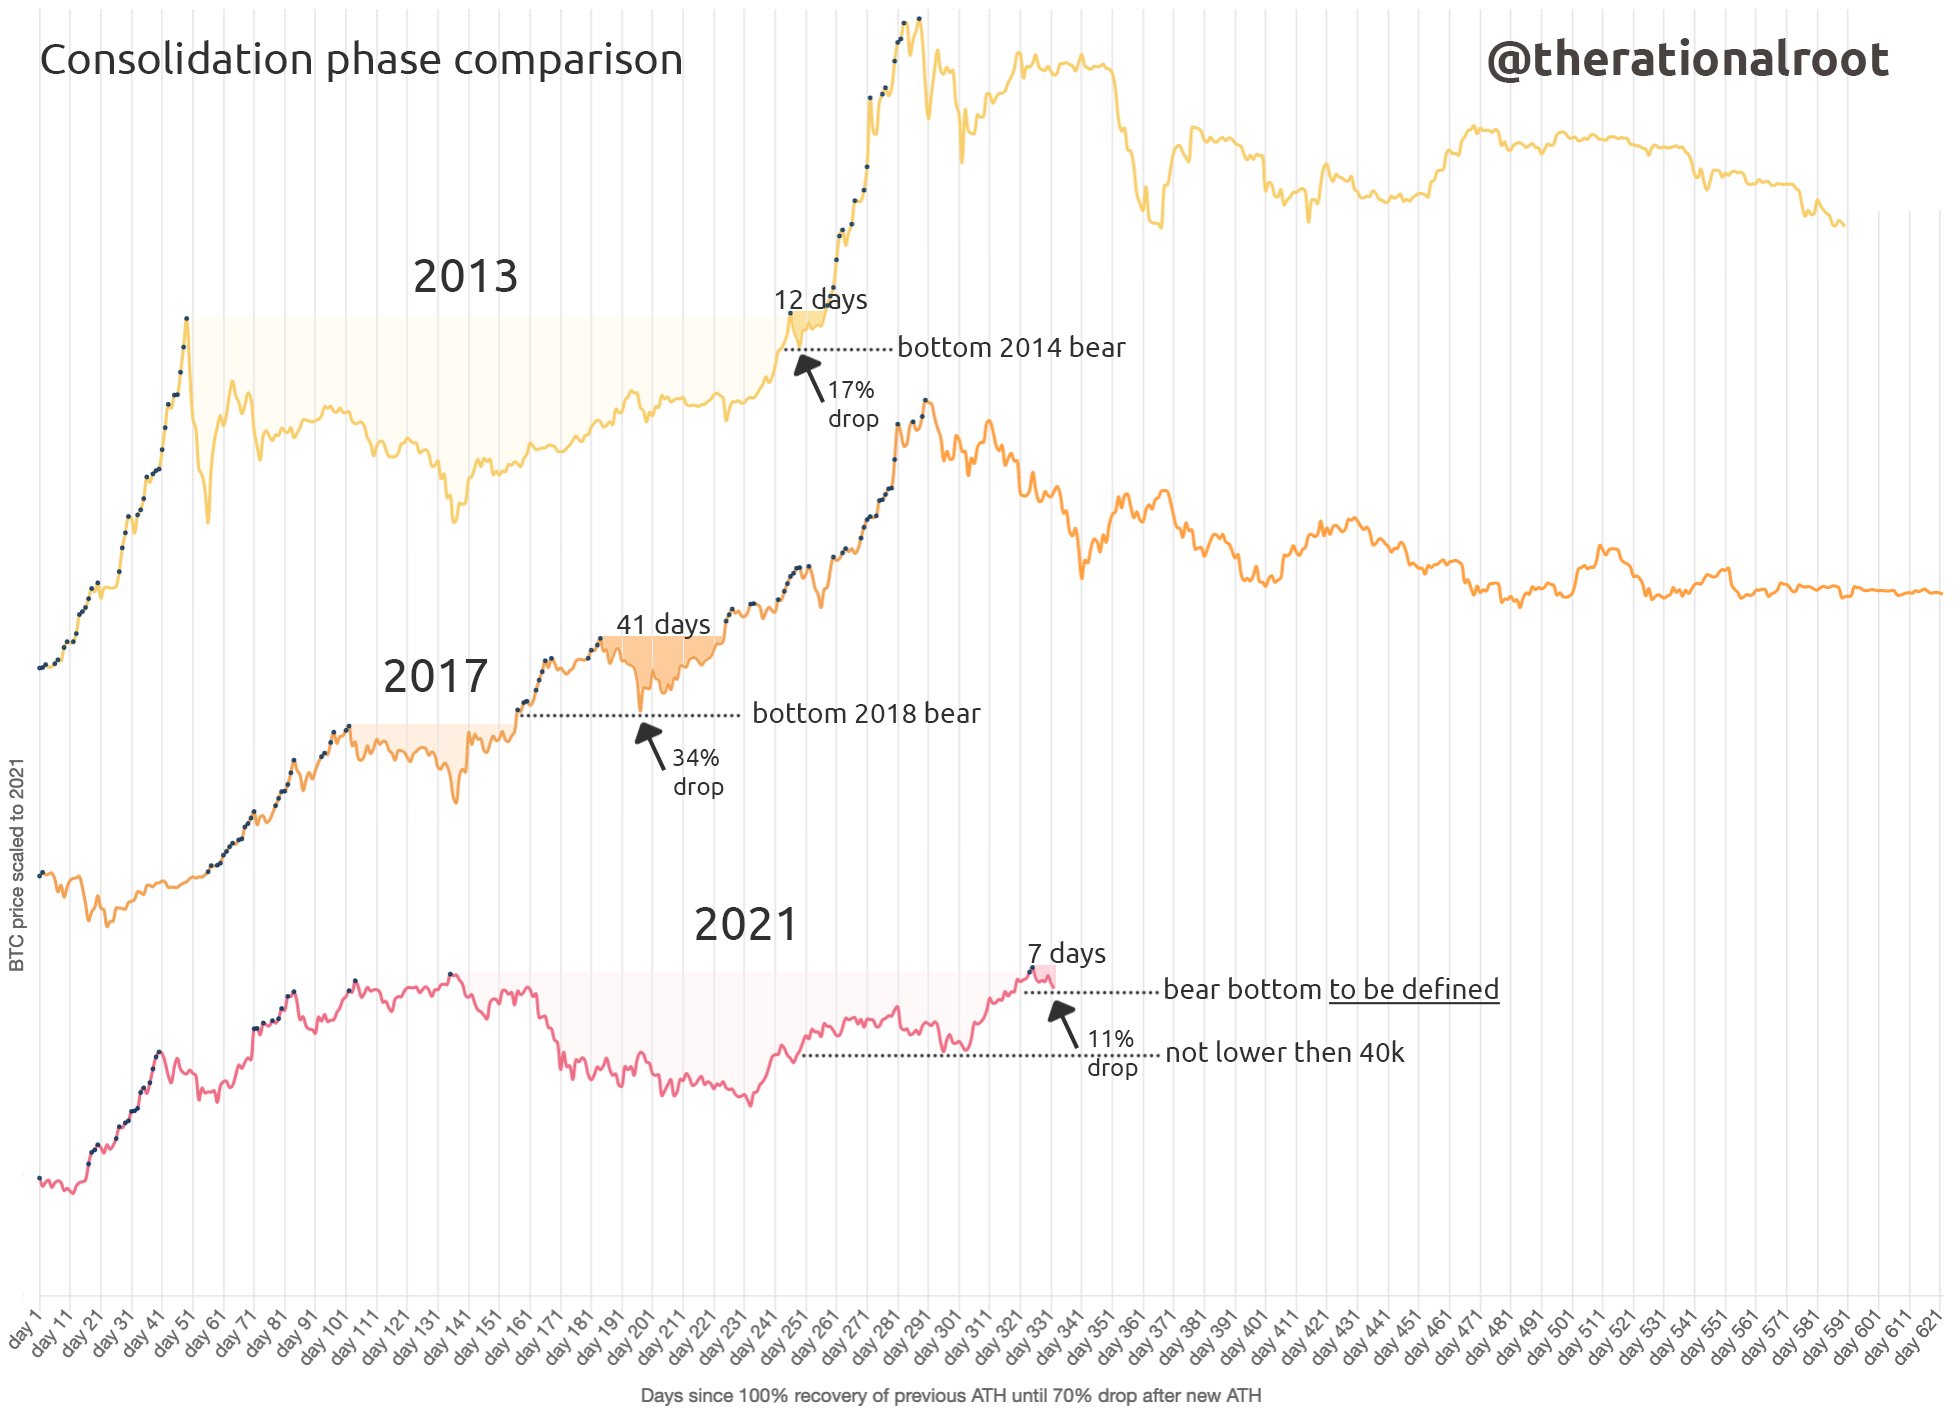
Just recently, pseudonymous analyst TheRationalRoot pointed out how BTC’s consolidation phase may just be complete. After setting a bear bottom, BTC may soon see a parabolic move up, he predicted.
However, a consolidation comparison over the three cycles i.e. 2013, 2017, and 2021 highlights how a pre-rally consolidation gives BTC a final pump.
That being said, for now, Bitcoin’s price has been pushed above $60k after spending a day under that level. BTC bulls have sufficient incentives to peg Bitcoin’s price above $60k on 29 October when the $3.2 billion monthly Options expiry settles.
With almost 52% of the contracts about to expire, BTC’s price on 29 October could dictate its rally in November. Either way, seems like BTC’s evolved direction at the moment is bound to push the asset north.


