Bitcoin at $60K: What’s stopping the surge?

Despite recent price corrections Bitcoin has been able to bounce back on the charts and continues to trade extremely close to the $60k resistance at the time of writing. During the past few days, Bitcoin has been able to register a complete recovery after having fallen to $52k towards the end of March. However as the price inches closer to the ATH, traders may be wary of another price drop if a sell-off were to take place. The chance of such a scenario is low but cannot be entirely ruled out.
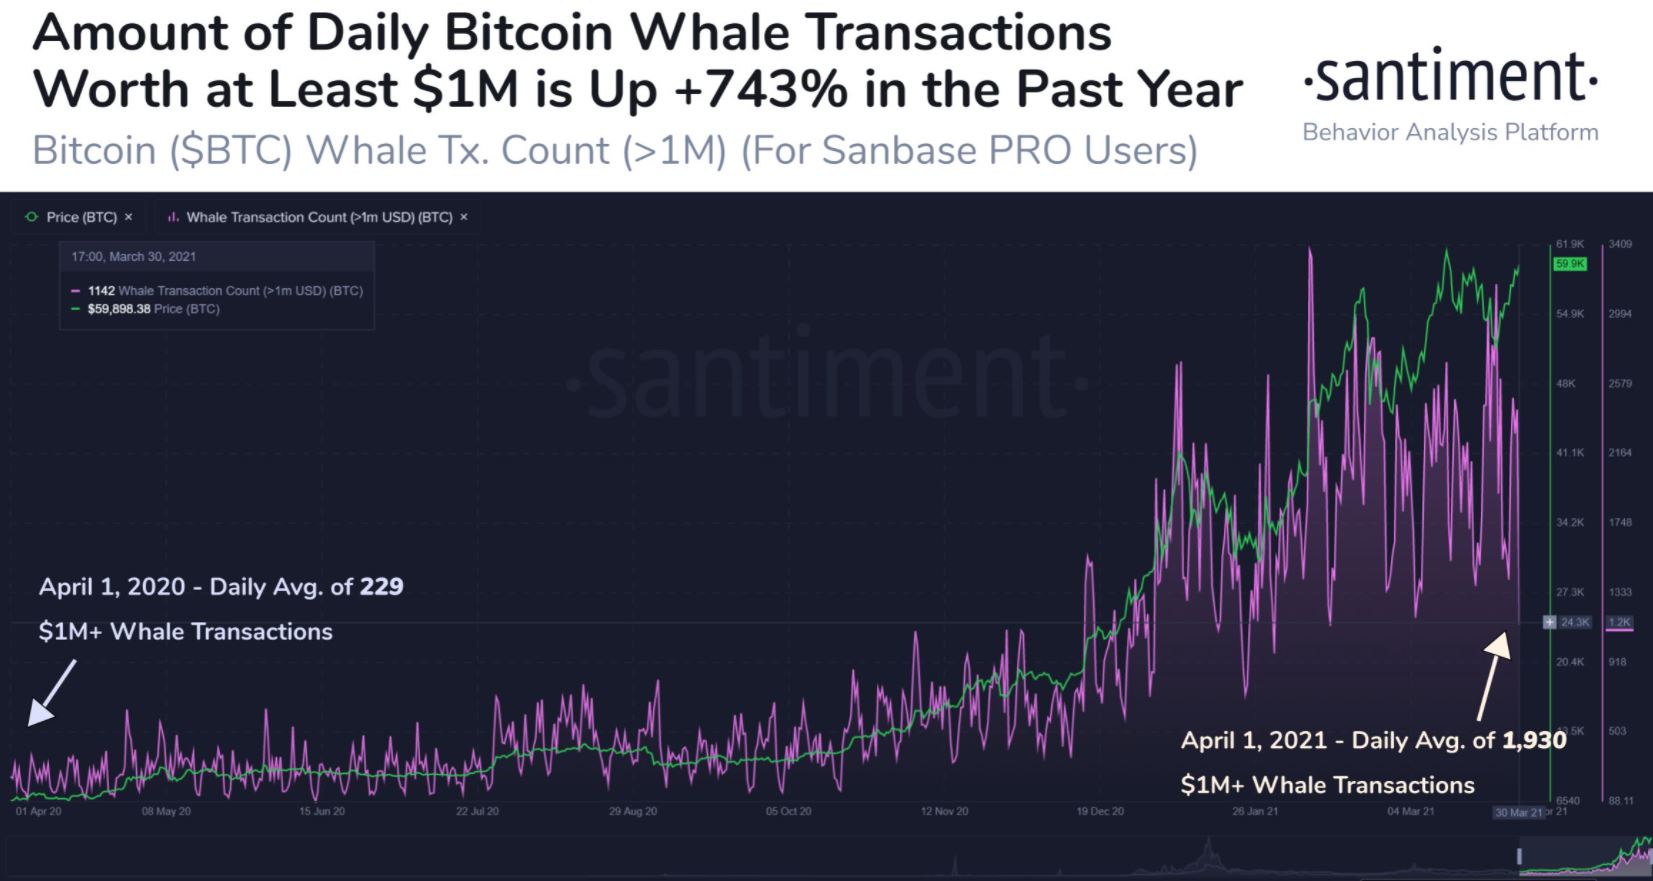
Interestingly, data provided by Santiment highlighted that whale transactions with over $1 million in value are now seeing increased activity. Around a year ago, whale transactions saw around 229 transactions per day and this figure has increased significantly and at the time of writing, BTC was witnessing around 1,930 whale transactions – amount to a whopping 734 percent increase.
While transactions and address activity is a good sign, this could also lead to whales selling their BTC thanks to its high valuation at the time of writing. However, this is not a major cause for concern for BTC traders, primarily because many of the coin’s whale addresses accumulated BTC even in the bull-market and the $60k price level would be too early to sell their coins given the price trajectory Bitcoin is currently on and the fact that it could reach $100k before the end of the year.

In addition to this, the amount of circulating supply last moved more than 10 years ago is also seeing a surge in activity according to data provided by Glassnode. According to the chart, active supply in the past 10 years hit an ATH of 2,024,764.179 BTC at the time of writing.
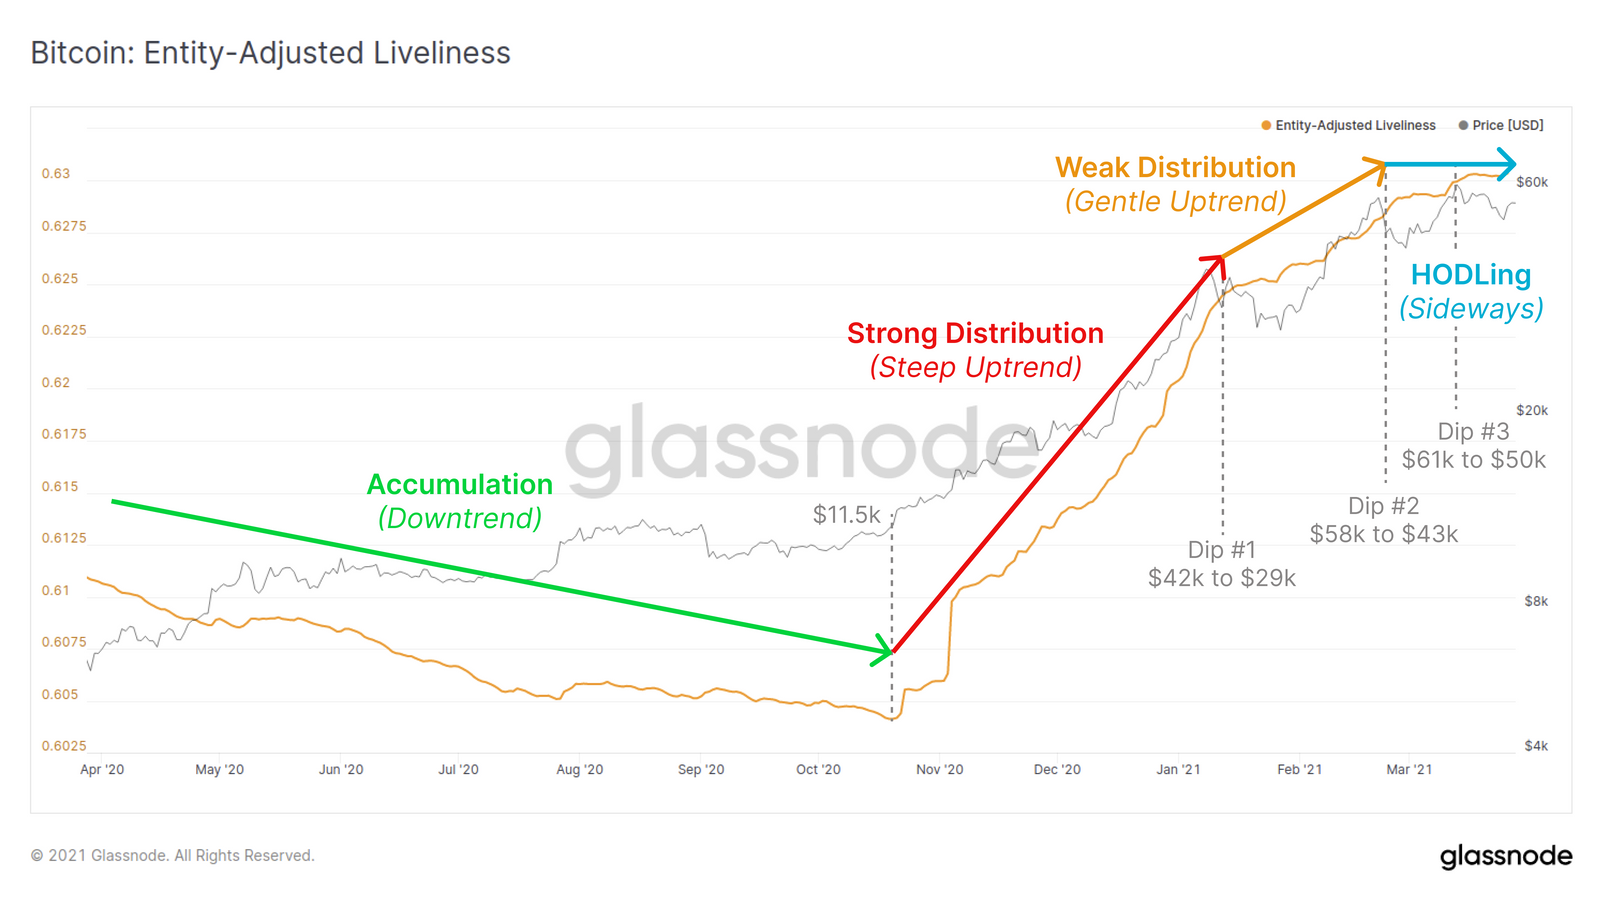
Understanding Bitcoin’s on-chain activity can also be helpful when it comes to getting a sense of the overall market sentiment. According to the entity-adjusted liveliness chart provided by Glassnode, it is evident that at the moment there are more coin days accumulated than destroyed and implies that HODLing behavior in the Bitcoin market continues to dominate. Illustrating the strong hodl sentiment in the market, the report pointed out that balanced accumulation and destruction suggesting HODLing is increasing and was especially relative to the preceding uptrend.
Another key bullish sign for Bitcoin was also the fact that for quite a while now exchange outflow has increased with very little BTC still in exchange addresses. Exchange balances have been in a consistent downtrend as traders have been transferring their coins into long-term storage. Over the past 12 months according to Glassnode, over 3.27% of the circulating BTC supply has migrated out of exchanges and into third-party wallets.
While it may seem tempting to sell and take short-term gains as BTC trades close to $60k the market isn’t likely to give in and a price correction may not take place this time around. BTC has significant bullish momentum at the time of writing and is likely to try and breach its resistance as traders hope for increased price discovery past its ATH as Q2 of 2021 progresses.