Bitcoin ‘breaks free’ of S&P 500 correlation: What does this mean?

The corrections in the U.S stock market earlier this week fueled a fear among many that a pullback in Bitcoin’s price may be incoming too. Such fears were later validated, with the crypto-asset trading below $18,500, at press time.
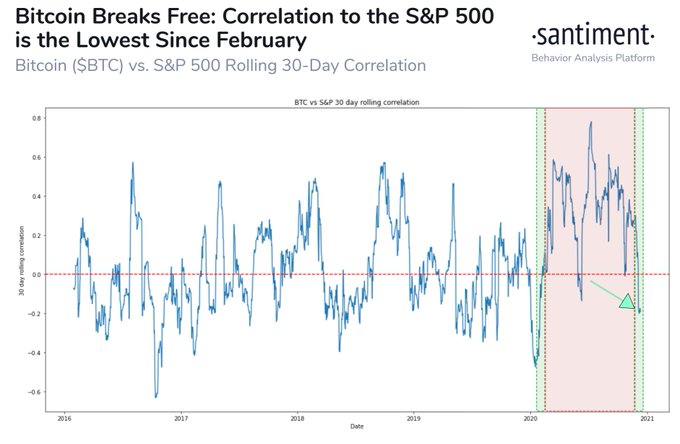
Bitcoin has been in an unfavorable position since it dropped below $19,000. After the price dropped below $19,500, the crypto-asset made 3 successful recoveries. However, despite all that, BTC was able to break free of the S&P 500 over the past 3 days after it recovered from its sub-$18,000-levels.
Bitcoin longs may have become less appealing to traders on derivatives exchanges and though many on-chain analysts believe that a correction in U.S Stocks would lead to further corrections in Bitcoin’s price, the price seemed to have recovered from the $18,000-level. Since the correction is low enough to have dropped, further corrections in the equities market may not result in a further drop in Bitcoin’s price.

Bitcoin’s correlation with S&P 500 || Source: Santiment
The inflows of Bitcoin to exchanges have now increased as miners who were previously HODLing Bitcoin are now selling again. Further, the Miner’s position index also hit a new high.
Bitcoin is under increasing selling pressure and on-chain analysts predict a further correction. However, in the long run, breaking free of the S&P correlation may be bullish for Bitcoin’s price just as breaking free of the correlation with Gold led it to hit a new ATH. Post-August 2020, there was a phase when Bitcoin was behaving like a tech stock, however, not anymore.
Ever since Bitcoin hit its new ATH, $19,500 has become Bitcoin’s resistance for 2020. Going beyond $20,000 may have become a pipe dream for many. Further, while buying from institutions is set to push the price higher on the charts, for now, BTC remains well below $19,000.

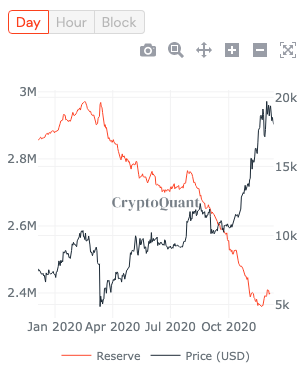
Bitcoin’s Exchange Reserve || Source: Cryptoquant
Based on data from CryptoQuant, Bitcoin’s exchange reserves are increasing and with a hike in liquidity, corrections become imminent. It is critical to watch the active supply of a volatile asset like Bitcoin for predicting the price trend, and the present liquidity level does not point to a trend reversal. There may be a further correction and a further drop in correlation with both the S&P 500 and gold as we head towards the yearly close.
Finally, some analysts have also been suggesting that altcoins may benefit from this dropping correlation as there may be an altcoin rally before the end of 2020, and it may have higher momentum and volatility, compared to Bitcoin. Only time will tell whether that pans out.


![Bitcoin [BTC]](https://ambcrypto.com/wp-content/uploads/2025/08/Bitcoin-BTC-400x240.webp)


