Bitcoin [BTC]: What you should expect following 2023’s 23% rally
![Bitcoin [BTC]: What you should expect following 2023's 23% rally](https://ambcrypto.com/wp-content/uploads/2023/01/1665608907310-6dff1a09-02c7-4cec-86f1-d28354fda536.jpg)
- The recent rally in BTC’s price led to many BTC holders netting unrealized gains.
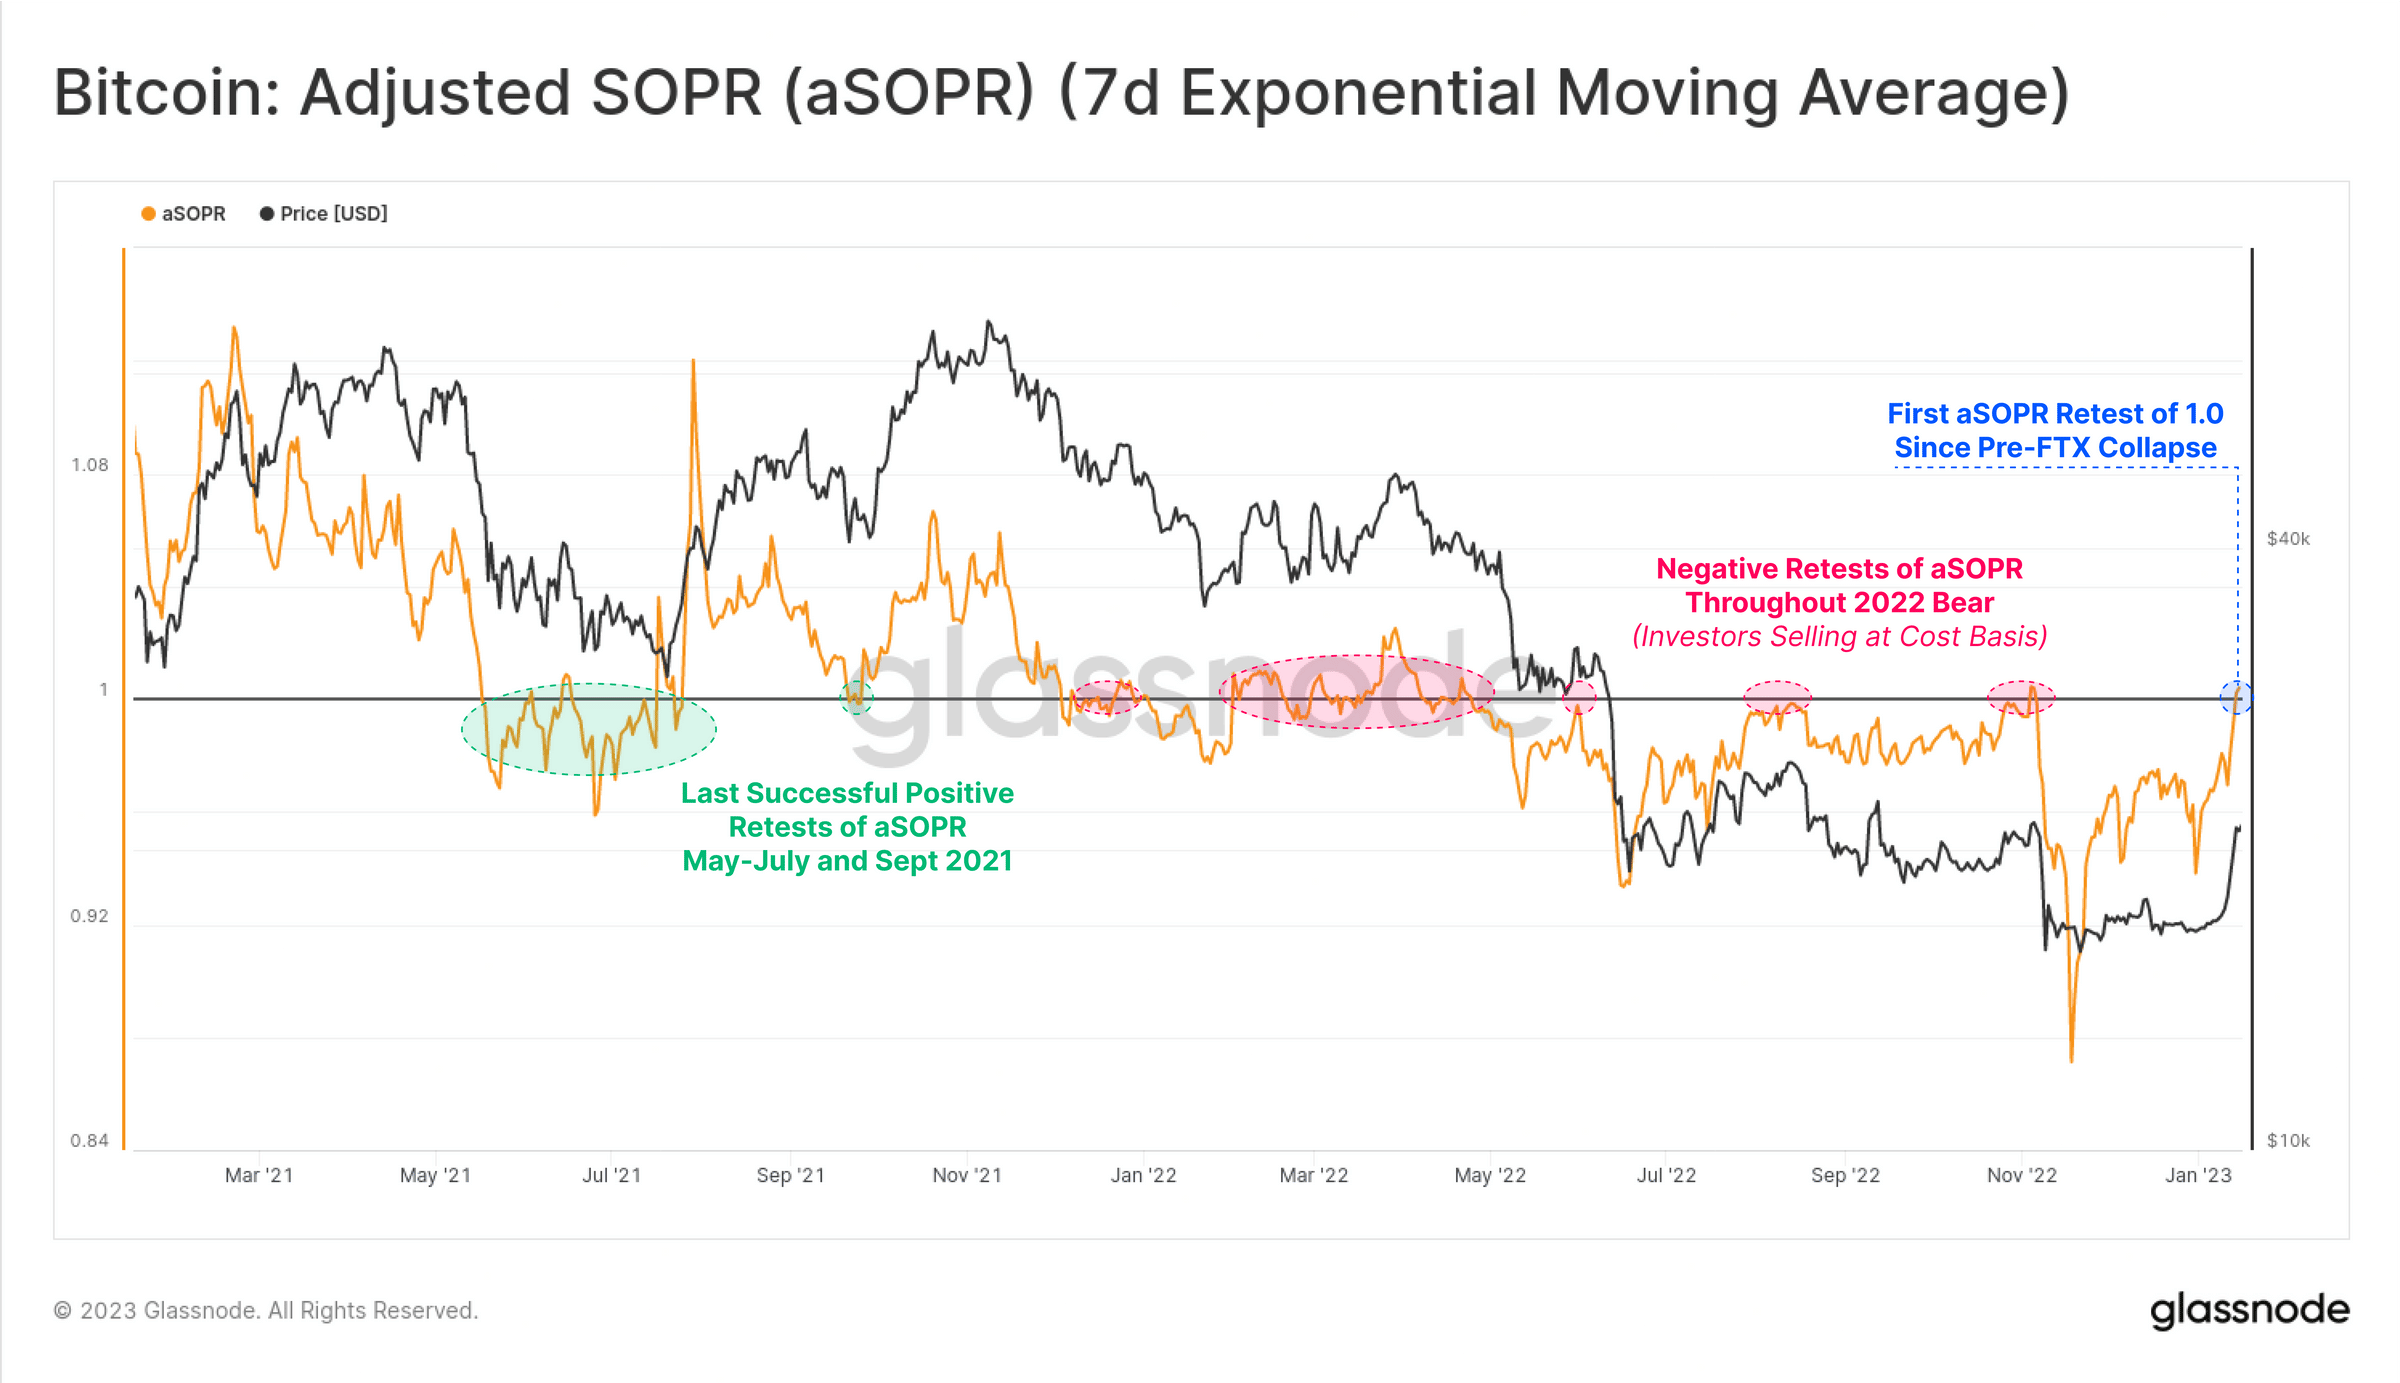
- The aSOPR’s attempt to retest the value of 1.0 signaled a bullish trend in the current market.
Bitcoin [BTC] started the year with a strong rally of 23.3%, which has resulted in a wide range of investors and miners seeing their net holdings and operations return to profitability.
Leading on-chain data provider Glassnode, in a new report titled “Is Bitcoin Back?”, assessed a few on-chain metrics to determine the meaning behind last week’s recent price surge and underlying factors behind the same.
Read Bitcoin’s [BTC] Price Prediction 2023-24
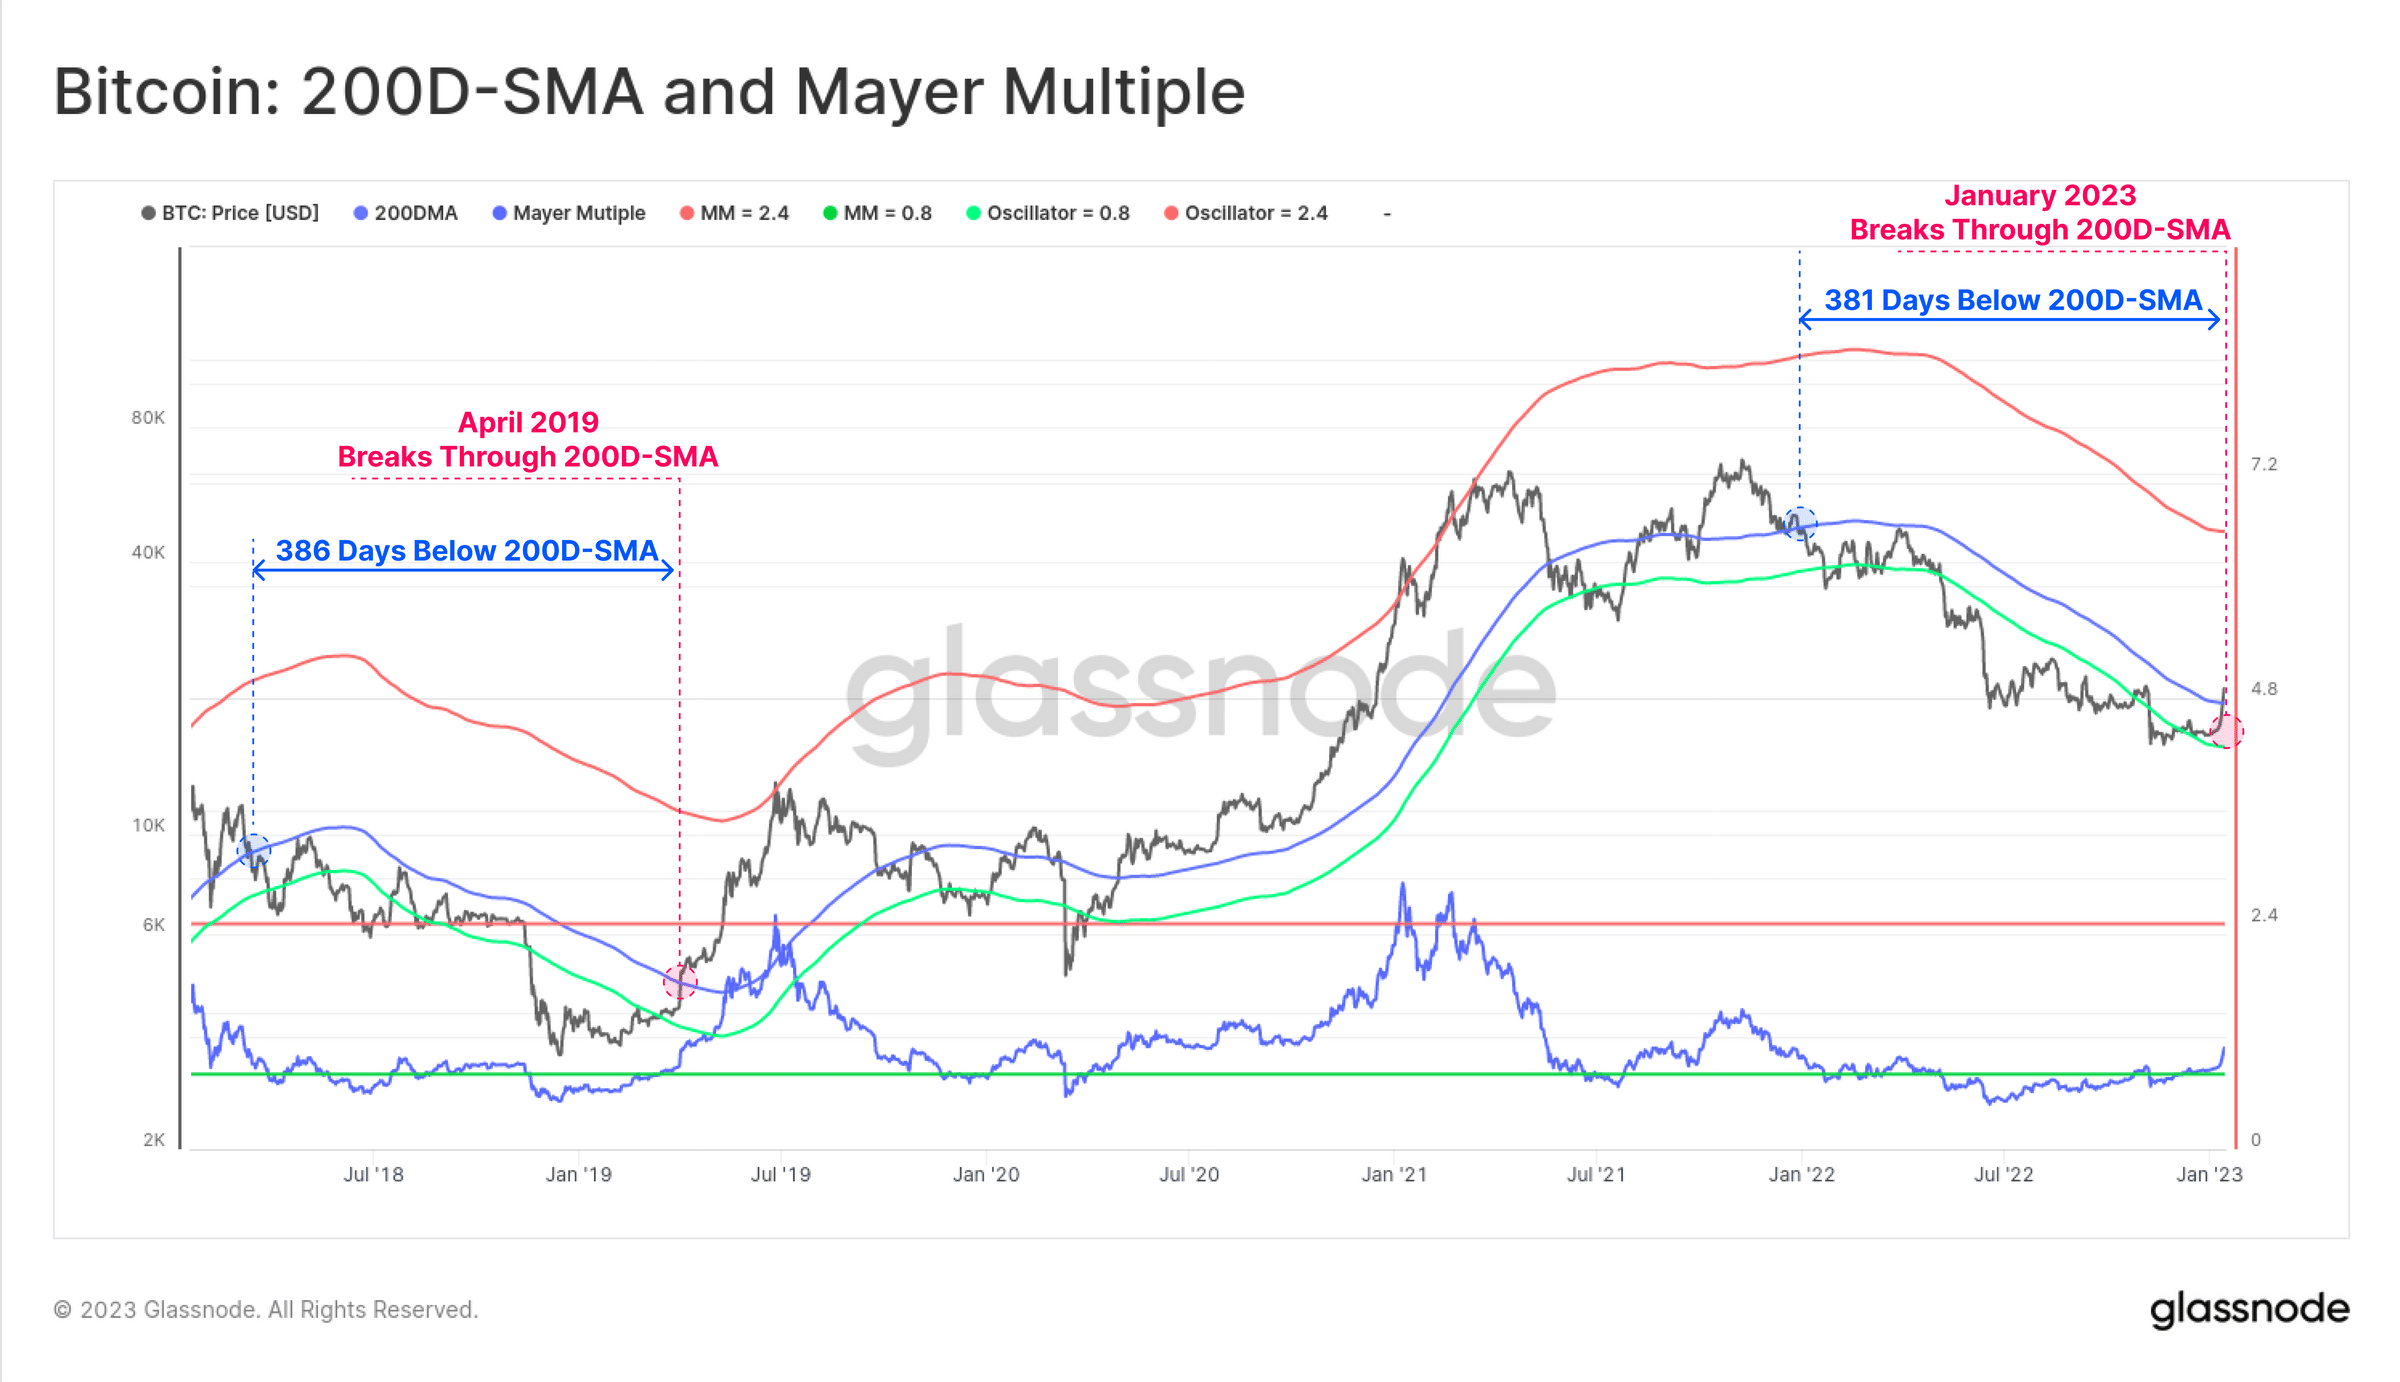
Glassnode considered BTC’s 200-day Simple Moving Average (200D-SMA) to confirm whether the sentiment in the market in the last week was bullish or bearish.
What do the metrics reveal?
The 200-day SMA metric is often utilized as a benchmark for identifying macroeconomic trends across all types of crypto assets. By comparing BTC’s price to its 200- day SMA, investors and traders alike can determine whether the market is in a bullish or bearish trend.
With the price uptick in the last week, Glassnode found that BTC’s price surpassed the psychological level of $19,500. It added further that BTC markets display a consistent pattern of cycles, with the current cycle trading below the 200D-SMA for 381 days, only slightly less than the 386 days of the bear market in 2018-2019.
Should BTC’s price break above the 200D SMA, one might expect the price to rally as it did in 2019 and 2021.
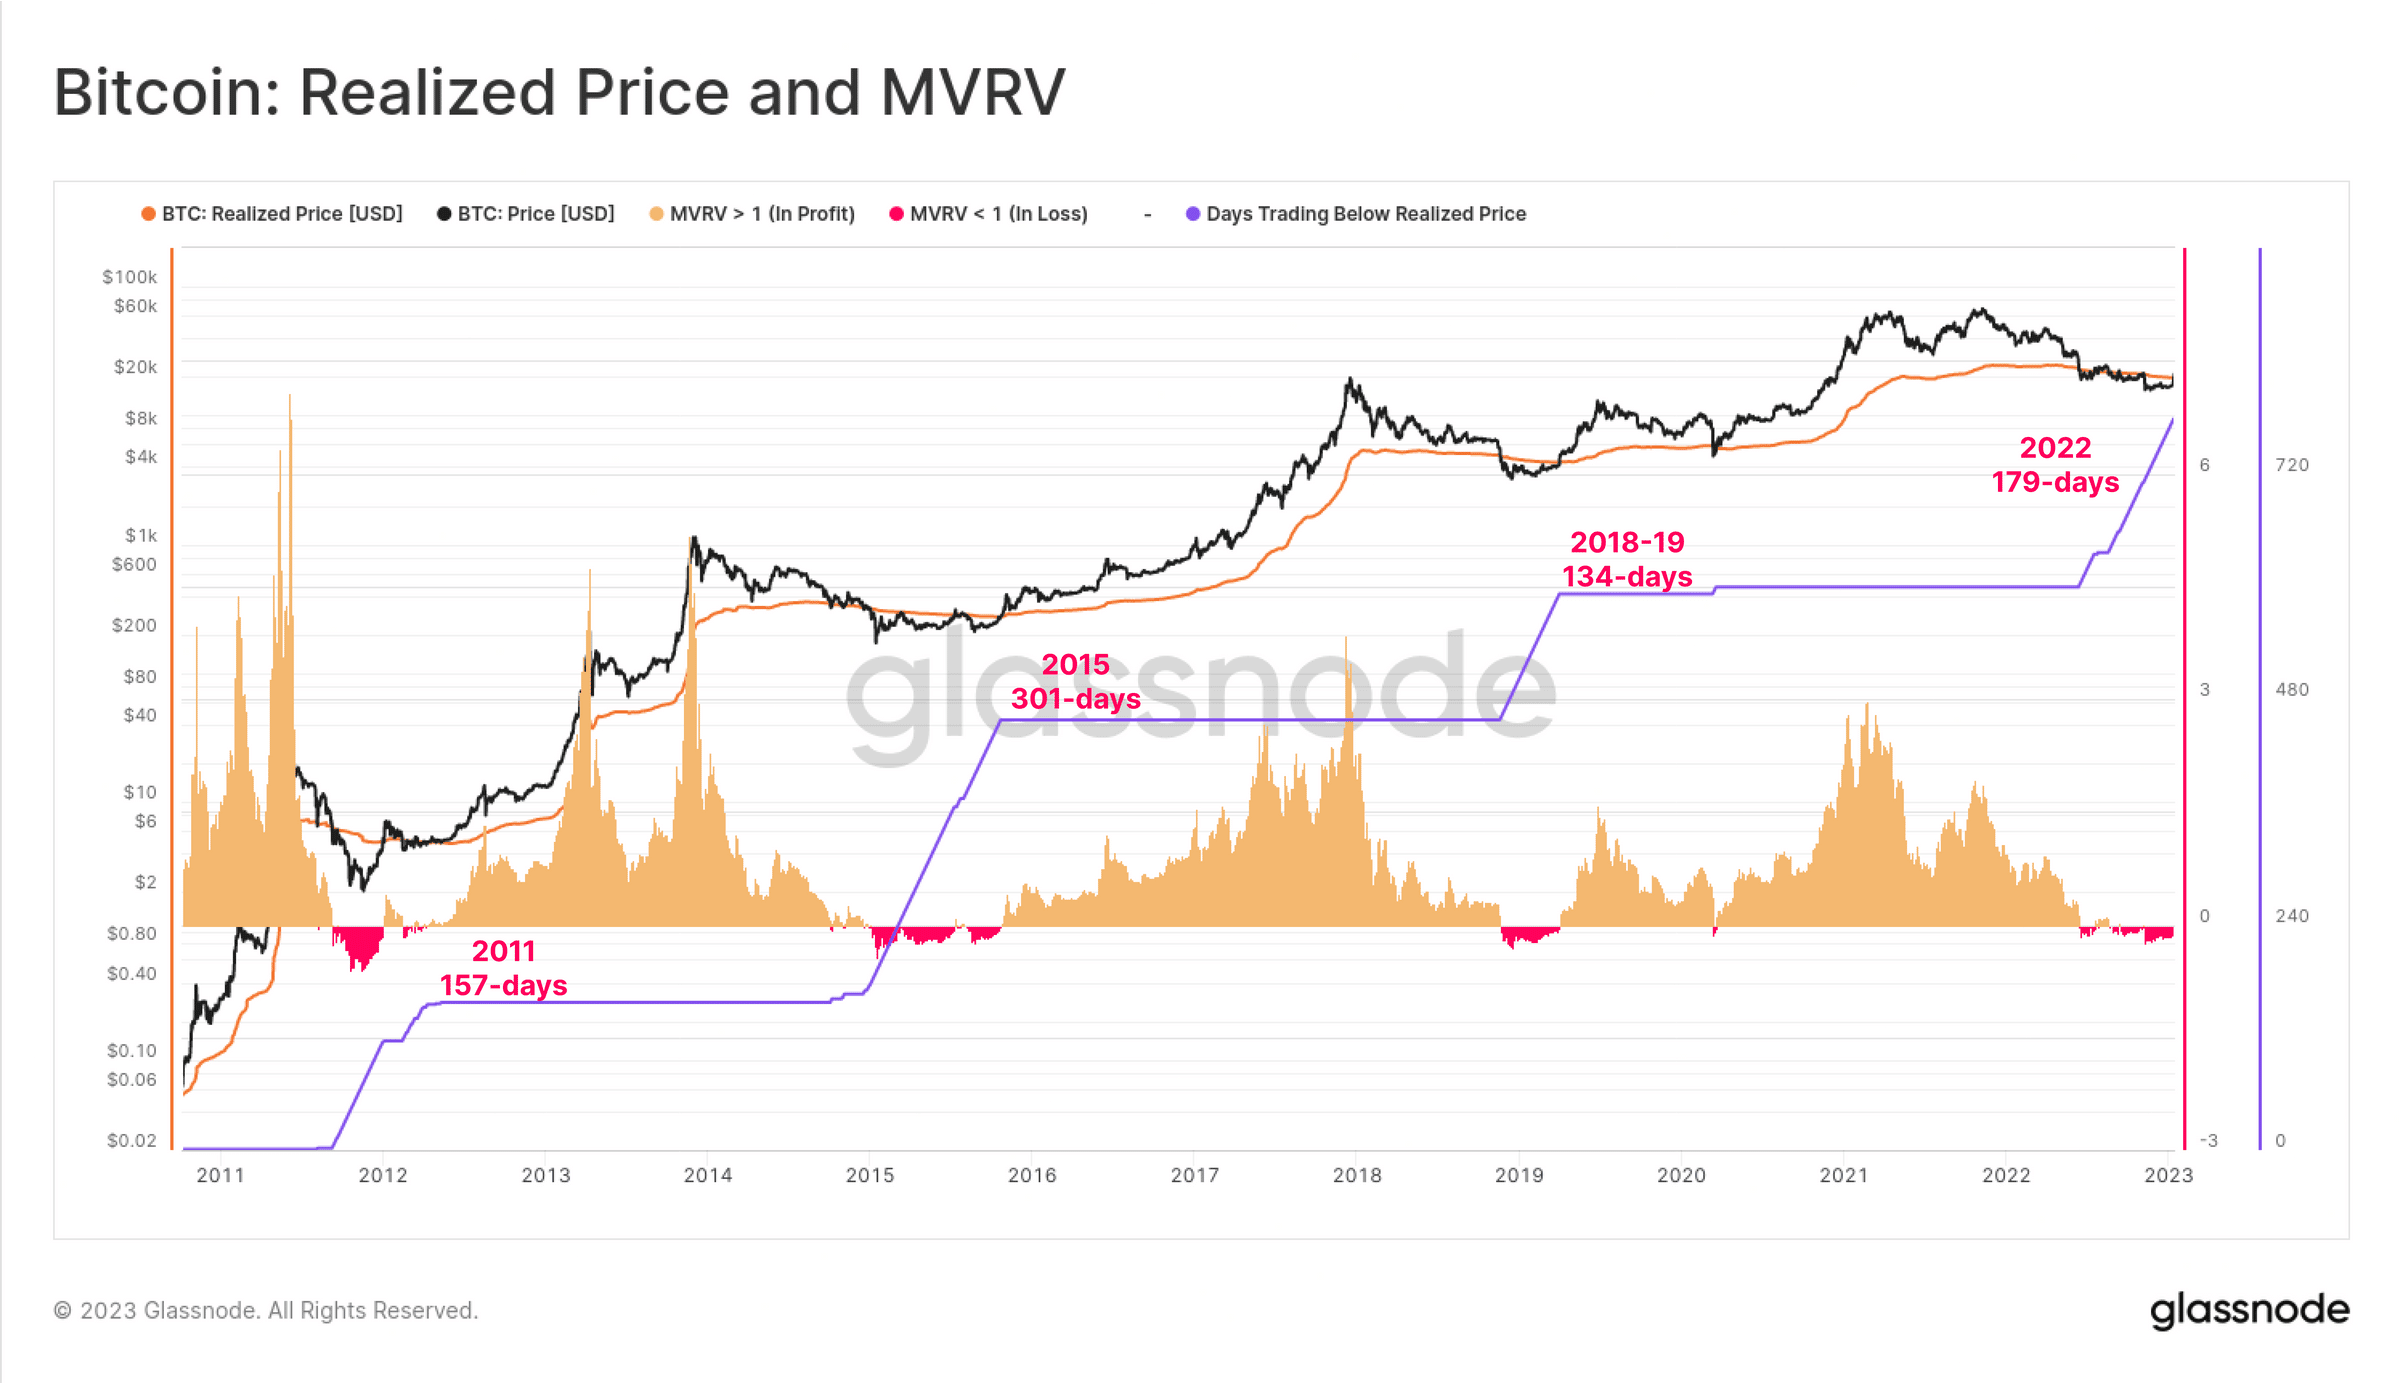
Glassnode further noted that the recent price rally caused BTC’s value to exceed its Realized Value, indicating that the average BTC holder experienced a net unrealized profit in the last week. For context, the current bear market has lasted for 179 days below the Realized Price, making it the second longest bear market out of the last four cycles.
Bitcoin’s aSOPR suggests…
A look at the king coin’s Adjusted Spent Output Profit Ratio (aSOPR) revealed that the metric would have retested a value of 1.0 from below. BTC’s aSOPR is a metric deployed towards measuring the profitability of BTC transactions by comparing the revenue generated by a transaction to the cost of creating it.
Is your portfolio green? Check out the Bitcoin Profit Calculator
According to Glassnode:
“An aSOPR break above, and ideally a successful retest of 1.0, has often signaled a meaningful regime shift, as profits are realized, and sufficient demand flows in to absorb them.”
When the 30-day moving average of the aSOPR exceeds 1.0, transactions become more profitable on a larger scale, which usually signals a strong overall market.