Bitcoin: Bulls and bears tussle for $26k
BTC's recent slump eased at a confluence area of May range-low and a daily bullish order block. Here's why $25.7 and $26.4k could be crucial levels.

Disclaimer: The information presented does not constitute financial, investment, trading, or other types of advice and is solely the writer’s opinion.
- The recent drop eased at a daily bullish order block and May range-low.
- Coinglass’s liquidation map marked $25.7k and $26.4k as key liquidity levels.
According to technical indicators on the lower timeframe charts, Bitcoin’s [BTC] short and mid-term prospects still don’t look good. In addition, over 80% of polled interest rate traders are inclined towards a possible Fed rate hike in the next September FOMC Meeting. This begs the question, are extra losses likely?
Is your portfolio green? Check out the BTC Profit Calculator
The recent price slump eased at a previous May range-low of $25.8k and a daily bullish order block (OB) of $24.8k – $26.0k (cyan). However, a solid recovery has remained elusive as bulls and bears tussle for $26k.
The H4 50-EMA retested as resistance
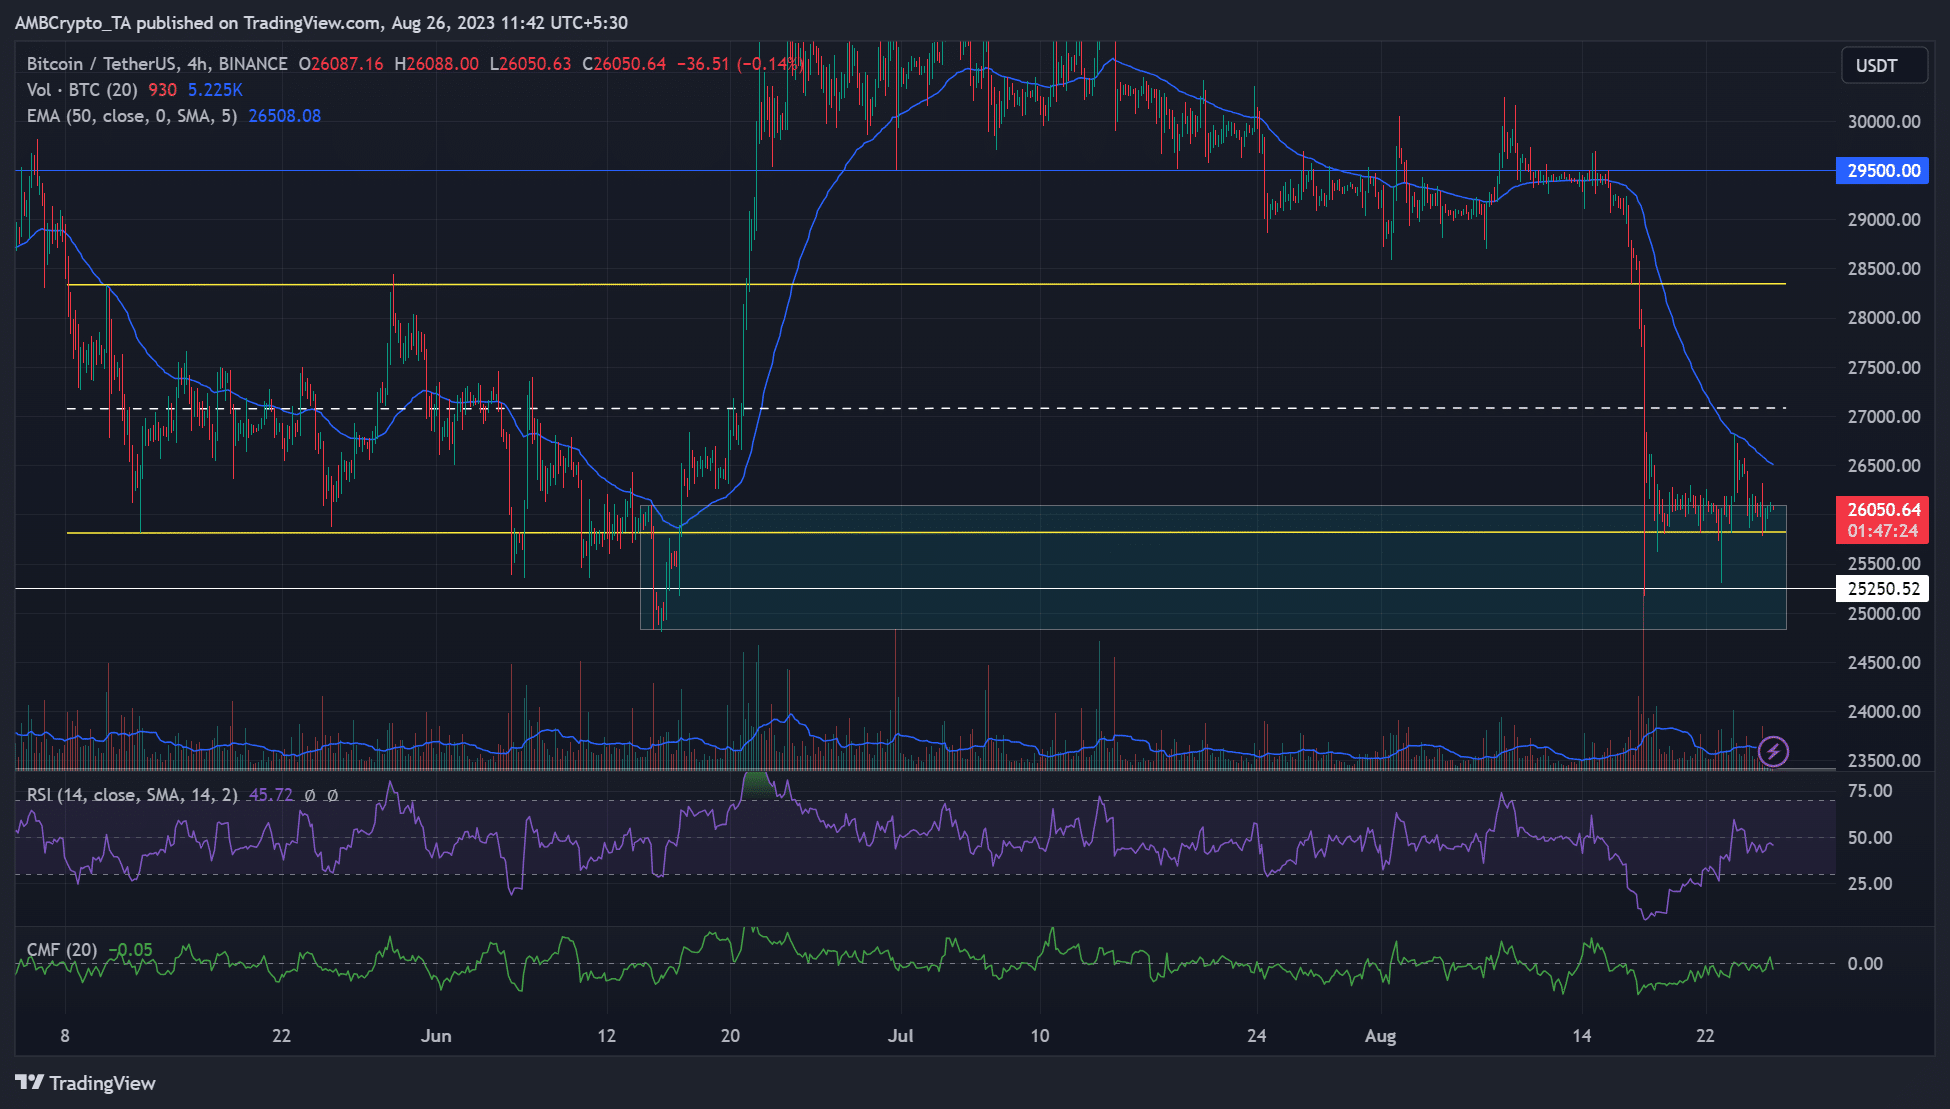
The zoomed 4-hour chart indicated that the current price levels coincided with the May range-low. BTC fluctuated between $25.8k and $28.3k in May, with a mid-range near $27k.
Interestingly, the above May range-low aligned with a daily bullish OB (cyan) and $25.2k support. The retest of the range-low could have led to a move up to the mid-range near $27k, but the price faced rejection at the 50-EMA (Exponential Moving Average) of $26.5k.
So, the mid-range and 50-EMA are crucial resistance levels for the next few hours/days. If sellers crack the confluence area, cyan, BTC could head lower, with the next support being a weekly bullish OB of $21.45k – $23.45k.
Meanwhile, the RSI improved but later retreated below the 50-mark and wavered below it – muted buying pressure. Similarly, the CMF fluctuated near the zero mark, underscoring wavering capital inflows for the BTC market.
Why $25.7k and $26.4k could be crucial levels

A look at Coinglass’s liquidation map shed some potential key levels to consider in the short term. For perspective, the liquidation map captures risk levels for the cryptocurrency futures trading market and is based on previous price trends.
Each liquidation bar represents how much a position could be affected when the price hits the level. Conventionally, higher “liquidation bars” tend to see stronger price reactions because of liquidity surges.
Read Bitcoin’s [BTC] Price Prediction 2023-24
Since the spot and futures markets have intricate influences, the liquidation map could offer nuanced insights into possible spot prices.
Ergo, the key levels in this particular BTC liquidation map from Binance Exchange are $26.4k and $25.7k on the daily timeframe. The $25.7k is near the range-low, while $26.4k is close to the H4 50-EMA resistance. So, the two levels were key price levels to watch in the short term.


