Bitcoin: Buying opportunities for BTC investors will arise if…

Disclaimer: The findings of the following analysis are the sole opinions of the writer and should not be considered investment advice
Bitcoin’s [BTC] four-month streak of lower highs and troughs finally ceased after its recent hike above the trendline support (white, dashed). While the recent movements affirmed an increase in buying edge, the sellers struggled to keep the price below the EMA ribbons.
Owing to the constant building-up of buying pressure near the 55 EMA, the buyers could aim to continue the up-channel recovery at the very least. At press time, BTC was trading at $23,077, down by 2.96% in the last 24 hours.
BTC Daily Chart
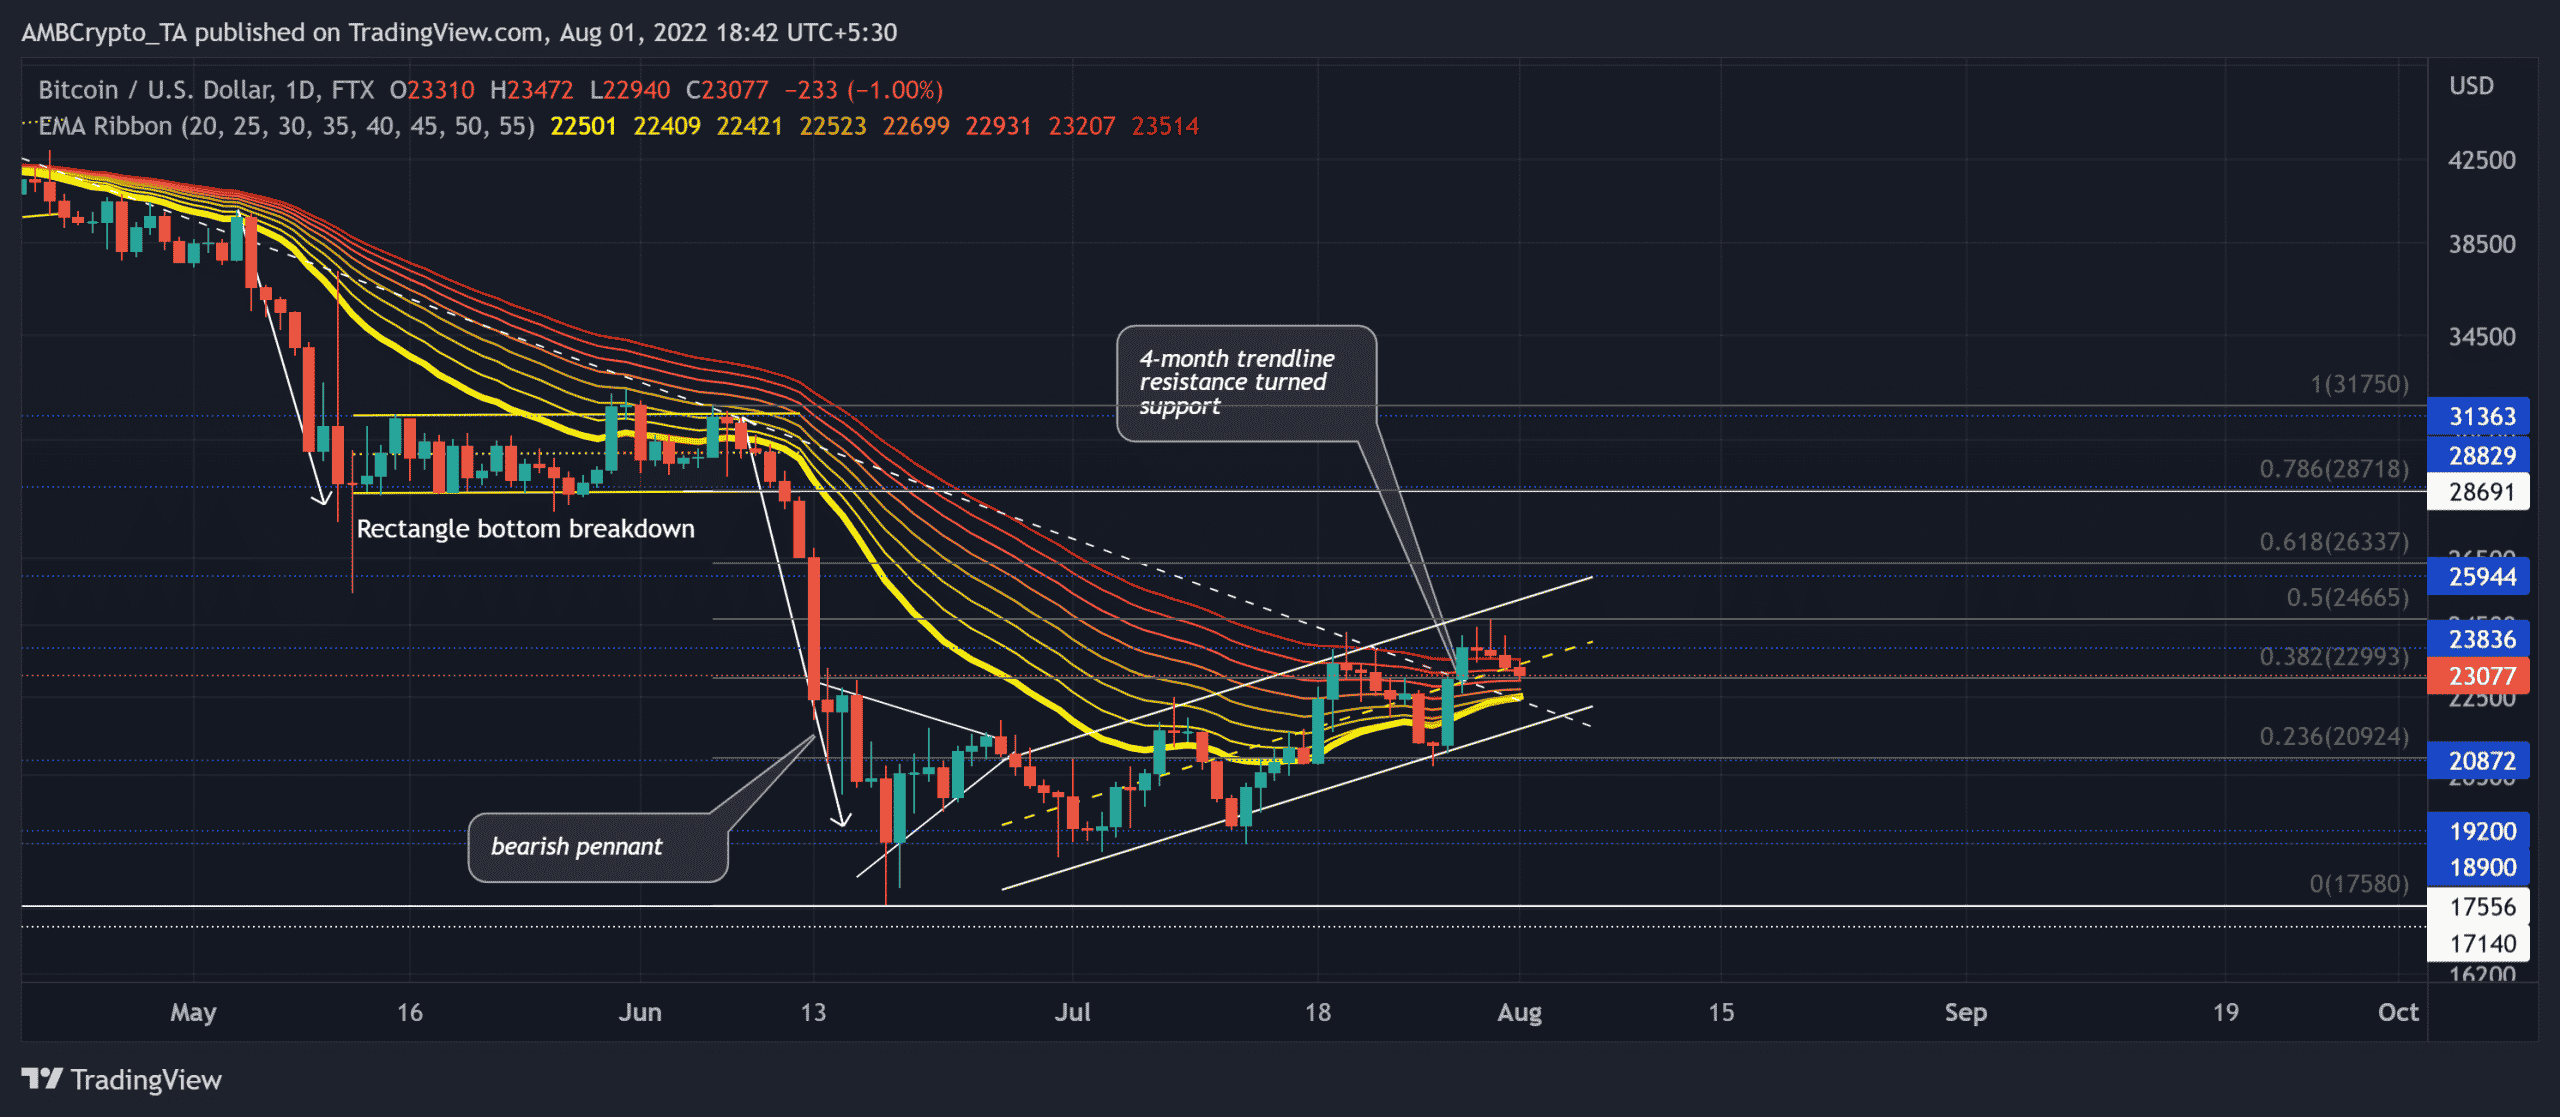
After an expected rectangle bottom breakdown, BTC’s southbound journey matched its December 2020 lows and halted within the $18.9k-$19.2k range.
Over the past month, the king coin has marked an up-channel recovery from its bearish pennant breakdown. An >24% ROI during this phase has helped BTC jump above its 20 EMA on the daily timeframe.
As the lower trendline of the up-channel coincided with the 20 EMA alongside the trendline support, the $22.4k-level could impede selling efforts.
A rebound from this level could propel a retest of the upper trendline of the up-channel in the $24.7k-$25k range. The buyers must wait for a convincing close above the ribbons before placing calls. Further, recent buying volumes have exceeded the near-term selling pressure. Unless the bulls see a meltdown in their vigor, BTC could continue its gradual growth in the coming days.
Rationale
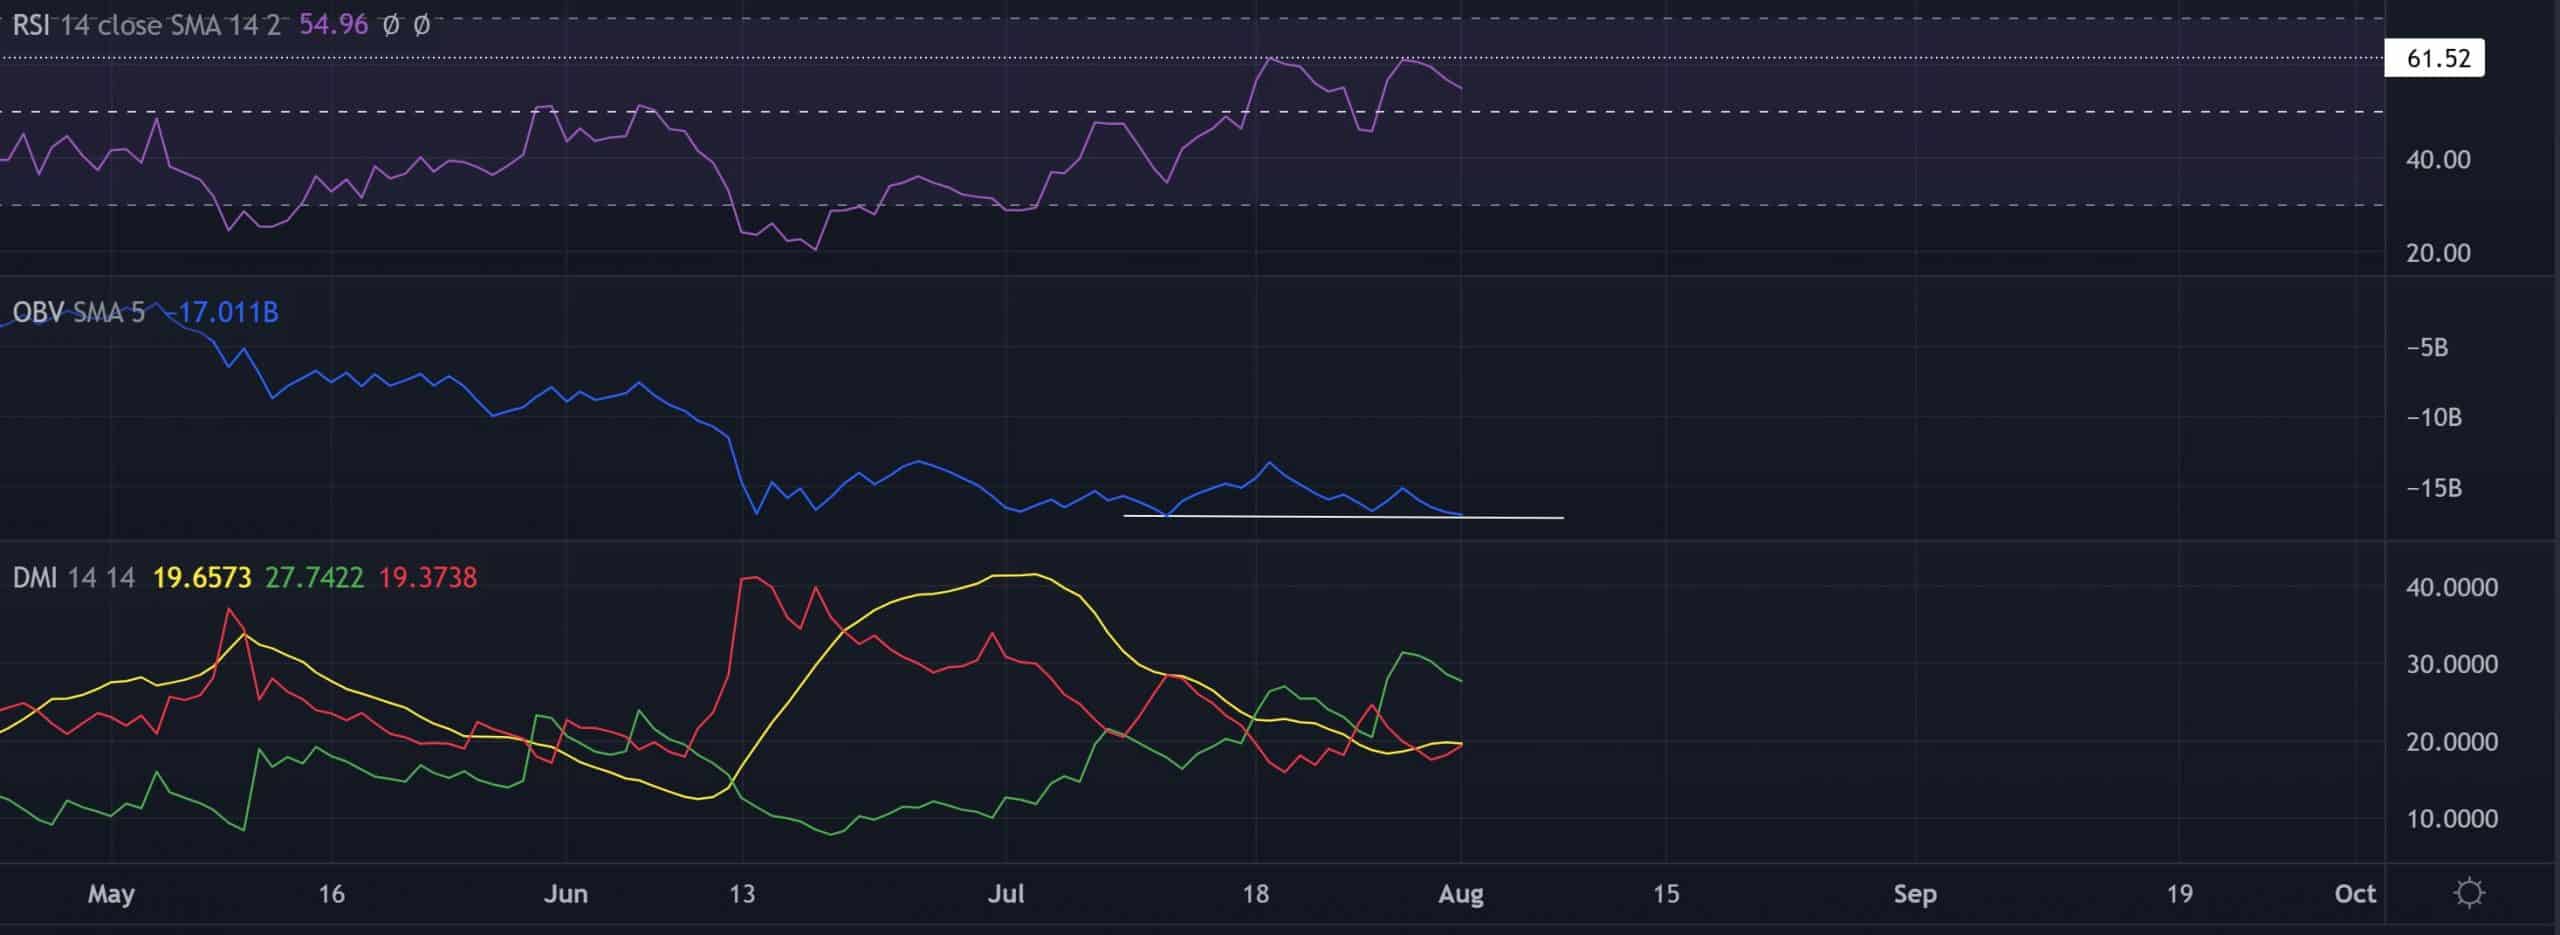
The Relative Strength Index (RSI)’s break above the midline resonated with the recent bullish edge. A close below the midline could point to potential bullish invalidation.
With the OBV seeing rather sluggish troughs over the last few weeks, any substantial revival could confirm a bullish divergence with price. Additionally, the DMI lines revealed a buying edge. However, the ADX projected a weak directional trend for the coin.
Conclusion
In light of the confluence of the trendline support and the up-channel alongside a slight edge on the indicators, BTC could continue its ongoing growth. The targets would remain the same as discussed.
Further, investors/traders should factor in macro-economical factors affecting the broader sentiment. This analysis will help them increase the chances of a profitable bet.