Bitcoin, Cardano, XRP Price Analysis: 22 May

Another flood of selling pressure erased nearly $200 Billion from the global crypto market cap over the last 24 hours. Market leaders Bitcoin and Ethereum moved back to monthly lows and tremors were felt across most alts. Large cap alts such as Cardano and XRP dropped below key support levels under severe bearish conditions.
Bitcoin [BTC]
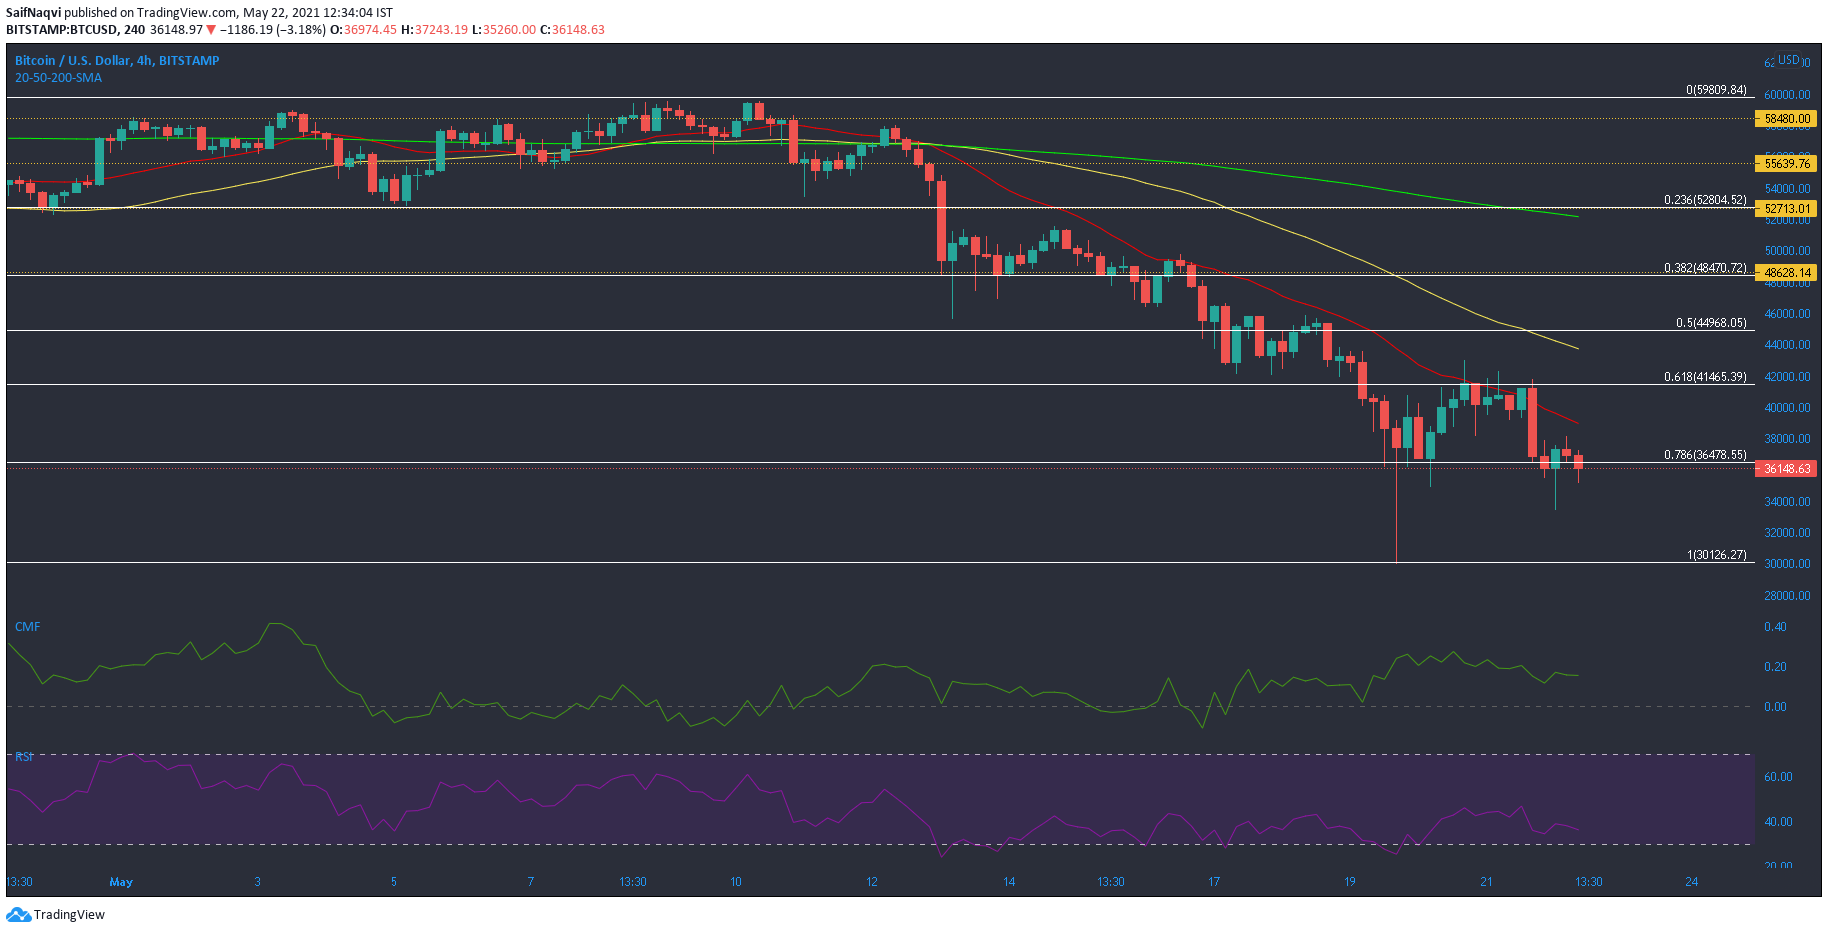
Bitcoin traded within $39,000-$41,000 range yesterday but was unable to force a breakout above this channel. Selling pressure returned and dragged Bitcoin towards the $35-mark. Naturally, the broader market followed suit and registered heavy losses over the lasts 24 hours. On the 4-hour timeframe, Bitcoin traded at the helm of its 78.6% Fibonacci level around $36,478. Another breakdown would see the market leader drop towards $30,000 and losing this level could have a catastrophic effect on its structure. On the other hand, a bullish outcome would be possible if BTC manages to break above the 61.8% Fibonacci level and $42,000.
RSI has traded in oversold region multiple times over the past week. While this development usually leads to a reversal, bearish sentiment had not yet dissipated. Chaikin Money Flow’s trajectory did bring in some optimism as capital inflows remained healthy despite the sell-off.
Cardano [ADA]
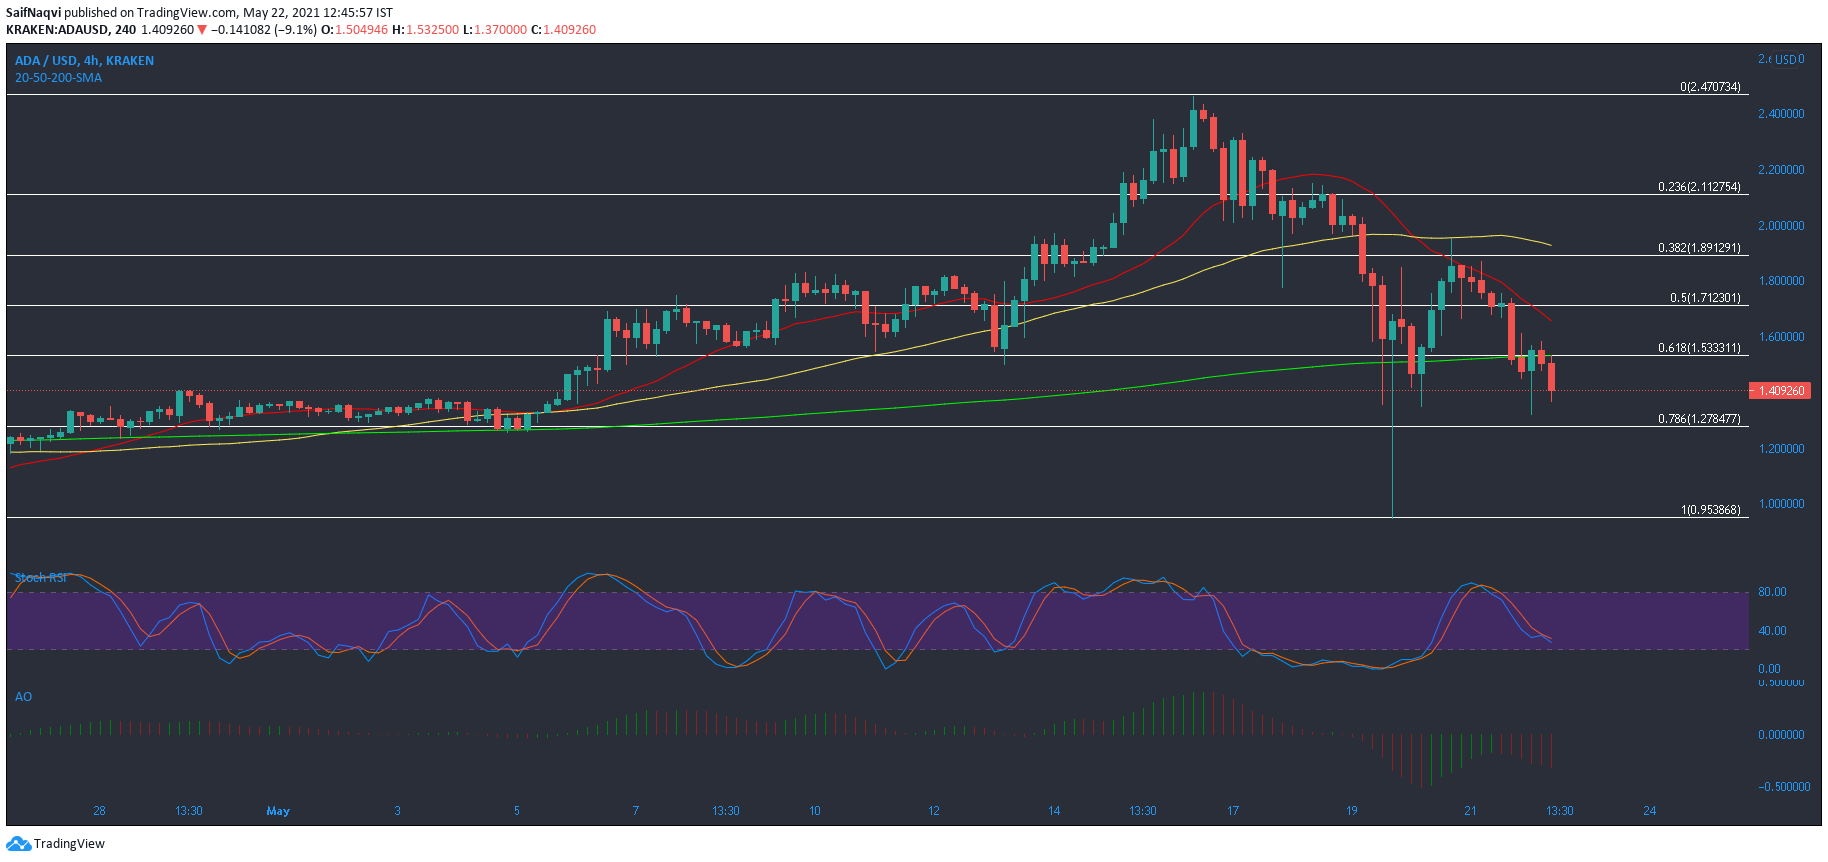
While it did seem plausible to set a buy order for Cardano at its 61.8% Fibonacci level ($1.53) close to its 200-SMA, another wave of selling pressure in the broader market crypto overburdened most alts. ADA was no exception as it slipped below its 200-SMA (green) and traded at $1.42 at press time. Further losses would take ADA to another support level at $0.953. To regain bullish control, ADA would need to target a rise above 38.2% Fibonacci level ($1.89) and 50-SMA (yellow).
As previously overserved, Stochastic RSI could languish in the oversold region for a few days before reversing its trend. Awesome Oscillator’s red bars highlighted rising selling momentum.
XRP
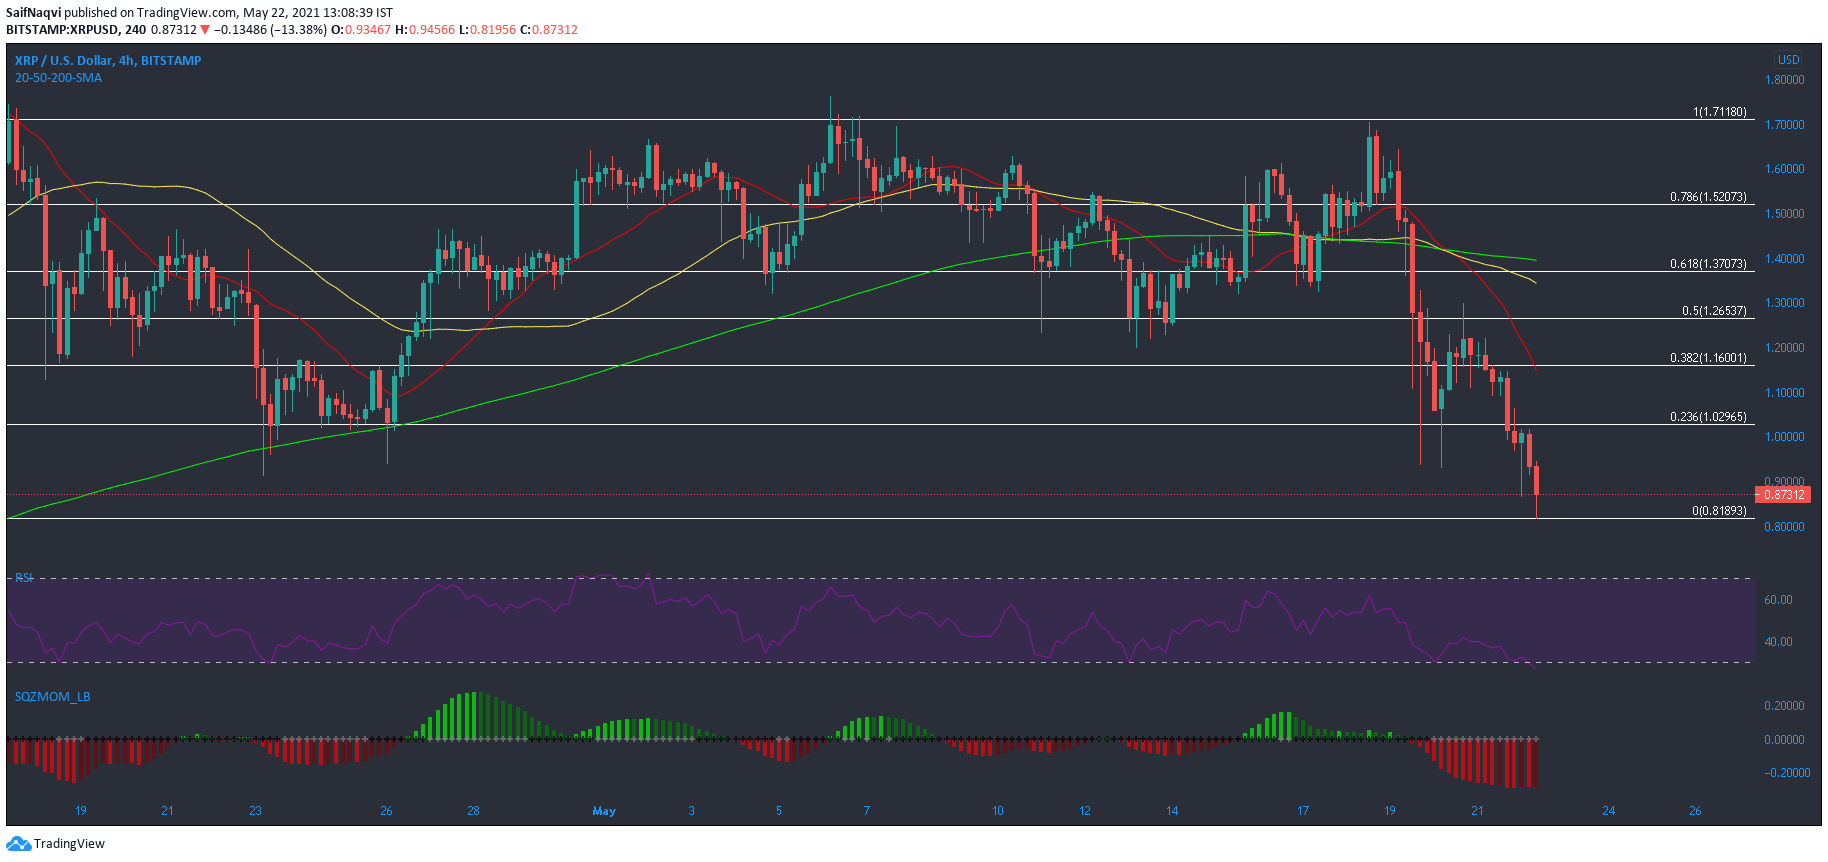
XRP losses were amplified over the last 24 hours as it lost out to the 23.6% Fibonacci level around the $1-mark. While XRP may not share a high correlation with Bitcoin, the lack of investor confidence was evident in its market as well. At press time, the beleaguered cryptocurrency traded at $0.873, down by 22% over the last 24 hours. A fall towards $0.818 would likely open up long signals but traders must wait for the market leaders to stabilize before making such a move.
Conversely, XRP bulls would become dominant if the price flips the 50% Fibonacci level ($1.26) and the 50-SMA (red). RSI highlighted oversold conditions. The last time RSI traded in this region for a prolonged period was back in December 2020 when the SEC lawsuit first came to light. Squeeze Momentum Indicator showed a volatile market and strong bearish momentum.