Dogecoin, Chainlink, Binance Coin Price Analysis: 22 May

With the ball now in Bitcoin’s court, onus fell on the market leader to rekindle bullish sentiment back into the crypto market. At press time, the king coin traded at $37,777 and had to reclaim the region above $42K to enable a swift recovery for most alts. While Dogecoin seemed to find support at $0.3223, Chainlink and Binance Coin dropped further on their respective charts.
Dogecoin [DOGE]

Dogecoin broke below $0.377 support and headed closer to another defensive line at $0.3223 on the 4-hour chart. On the hourly timeframe, a doji candlestick was spotted after a series of red candles and signaled a potential change in trend. If the market leaders move sideways over the coming sessions, DOGE could likely hold on to its present channel. A breakdown could trigger another 23% retracement towards $0.246-support. A fall towards April lows could even see DOGE snap $0.180.
Selling pressure was evident on the red bars of the Awesome Oscillator but a second lower peak could result in a bullish twin peak. A favorable outcome can be expected after such a setup. RSI remained in bearish territory at press time.
Chainlink [LINK]
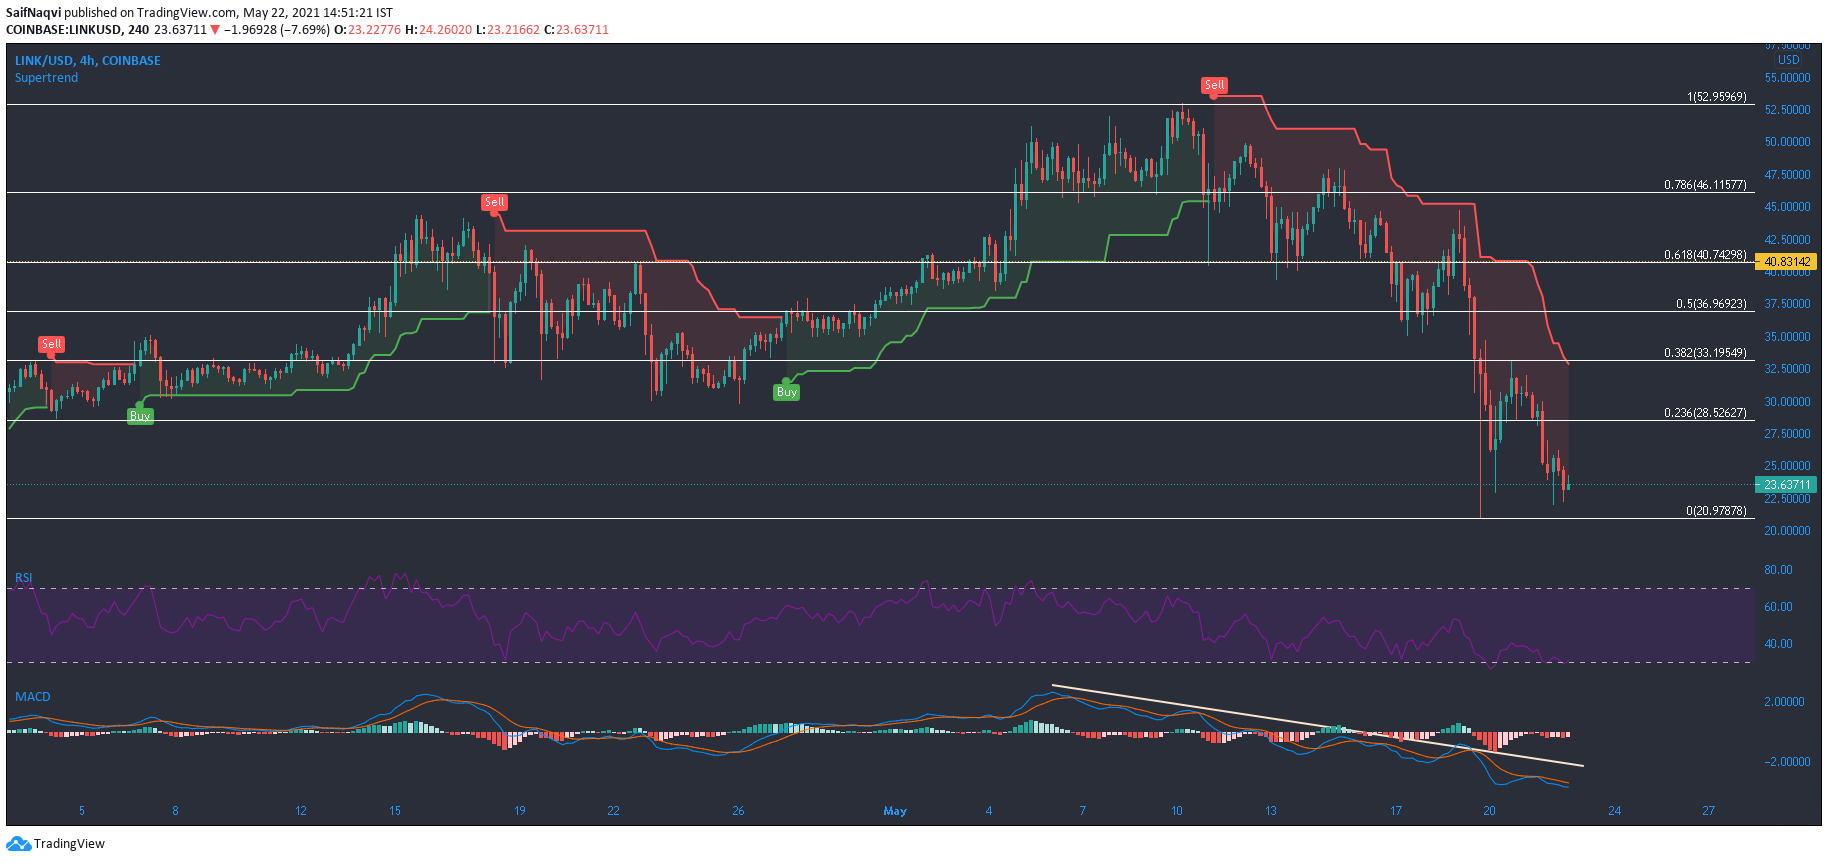
At press time, Chainlink traded at $24, down by 18% over the last 24 hours. With a crypto ranking of 14, its market cap dropped to $10.35 Billion. The Fibonacci tool was used to analyze LINK’s downfall and a possible road to recovery. A southbound move could see LINK drop below $20.97 and cause another 15% dip towards $17. If losses are maintained at $20.97, expect some sideways movement.
SuperTrend Indicator continued to flash a sell signal but would switch to buy at the 38.2% Fibonacci level ($33.19) – making this area of particular significance. Interestingly, MACD has been on a downtrend since early May and indicated weakness even prior to the broader market sell-off.
Binance Coin [BNB]
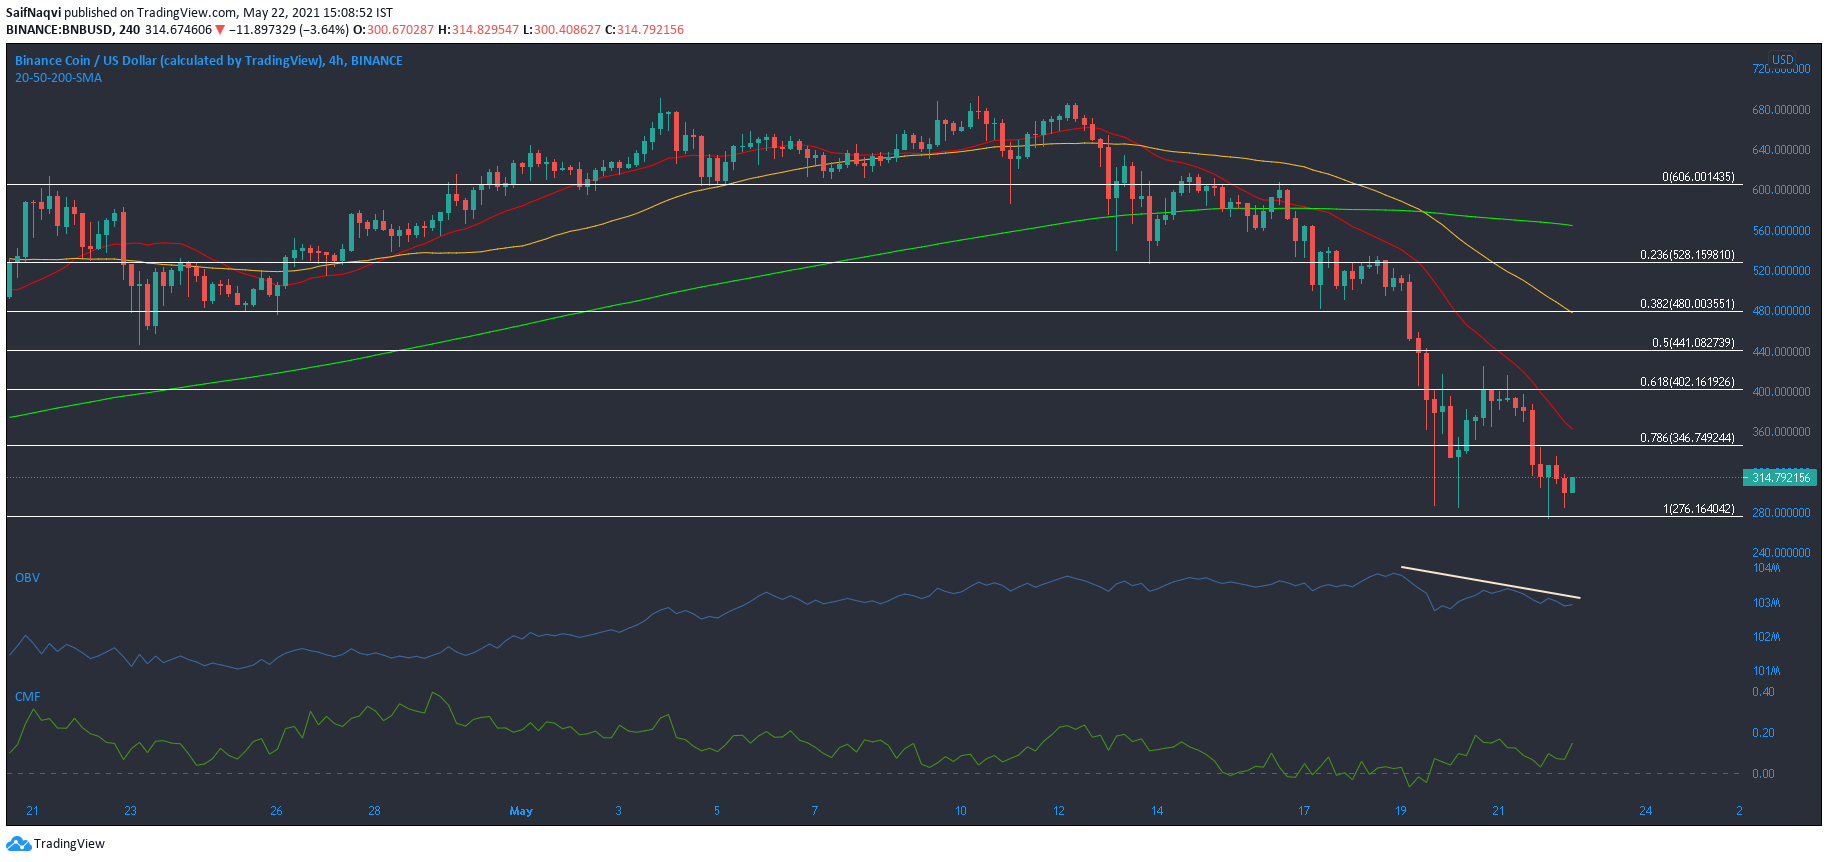
A single candlewick dropped as low as $274 on Binance Coin’s 4-hour chart as the cryptocurrency headed towards end-March levels. Further dips would see BNB negate its bull run between April-May- one that saw a surge in value of 200% in just two months.
Conversely, regaining the area above 61.8% Fibonacci ($402.16) could trigger a 20% hike towards the next target at $480. However, the broader market would largely dictate such price action. OBV’s downtrend showed that selling pressure had constantly outmatched buying pressure over the past few days. Meanwhile, the flow of institutional capital remained healthy according to CMF.