Bitcoin Cash, Algorand, DigiByte Price Analysis: 26 January

Bitcoin Cash floated above its 200-SMA and a move below this level was not expected over the next few trading sessions. ALGO’s short-term movement was mixed and a move in either direction would be dependent on cues from the broader market. Finally, DGB formed a bullish divergence on the CMF, projecting that the price could pick up on the charts.
Bitcoin Cash [BCH]

Source: BCH/USD, TradingView
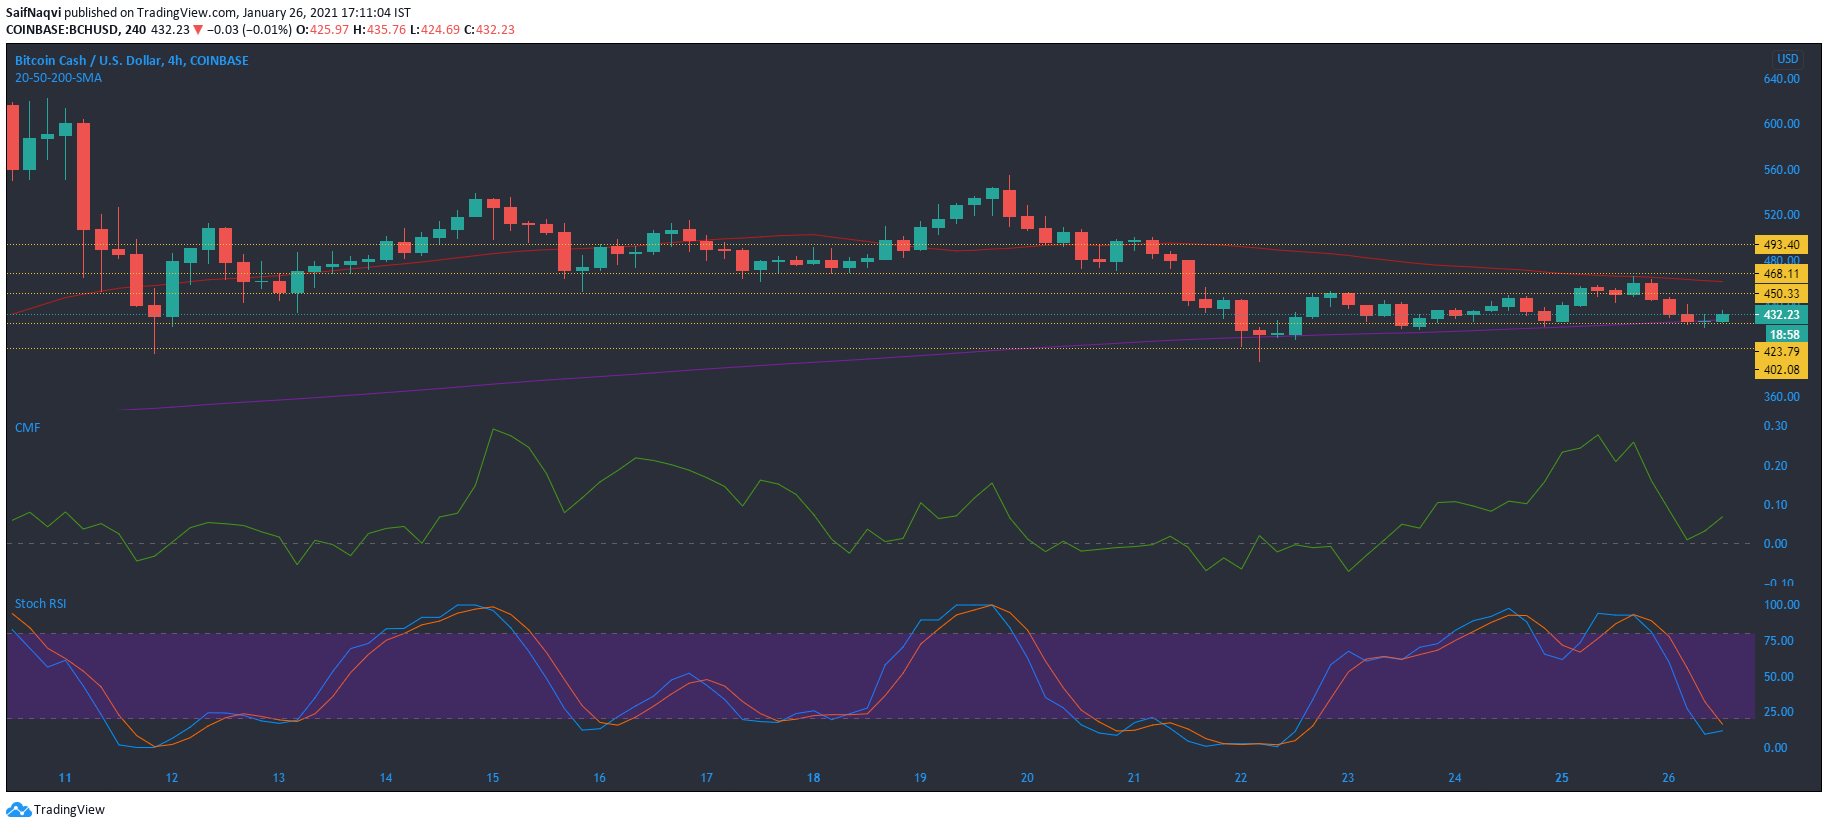
Bitcoin Cash hovered just above the $423.8 support level, at press time, after the bulls rushed in to alleviate some of the selling pressure in the market. The 200-SMA (purple) also acted as a defensive barrier and prevented a move lower on the charts. However, a move below this level over the next few trading sessions could signal an extended bearish market.
At press time, the indicators sided with the bulls and suggested that the price could hold above the $423.8-support level. The Chaikin Money Flow picked up from the half-line and highlighted the uptick in capital inflows into the market.
Finally, the Stochastic RSI was in the oversold zone and a reversal might be key to the price going the other way.
Algorand [ALGO]

Source: ALGO/USD, TradingView
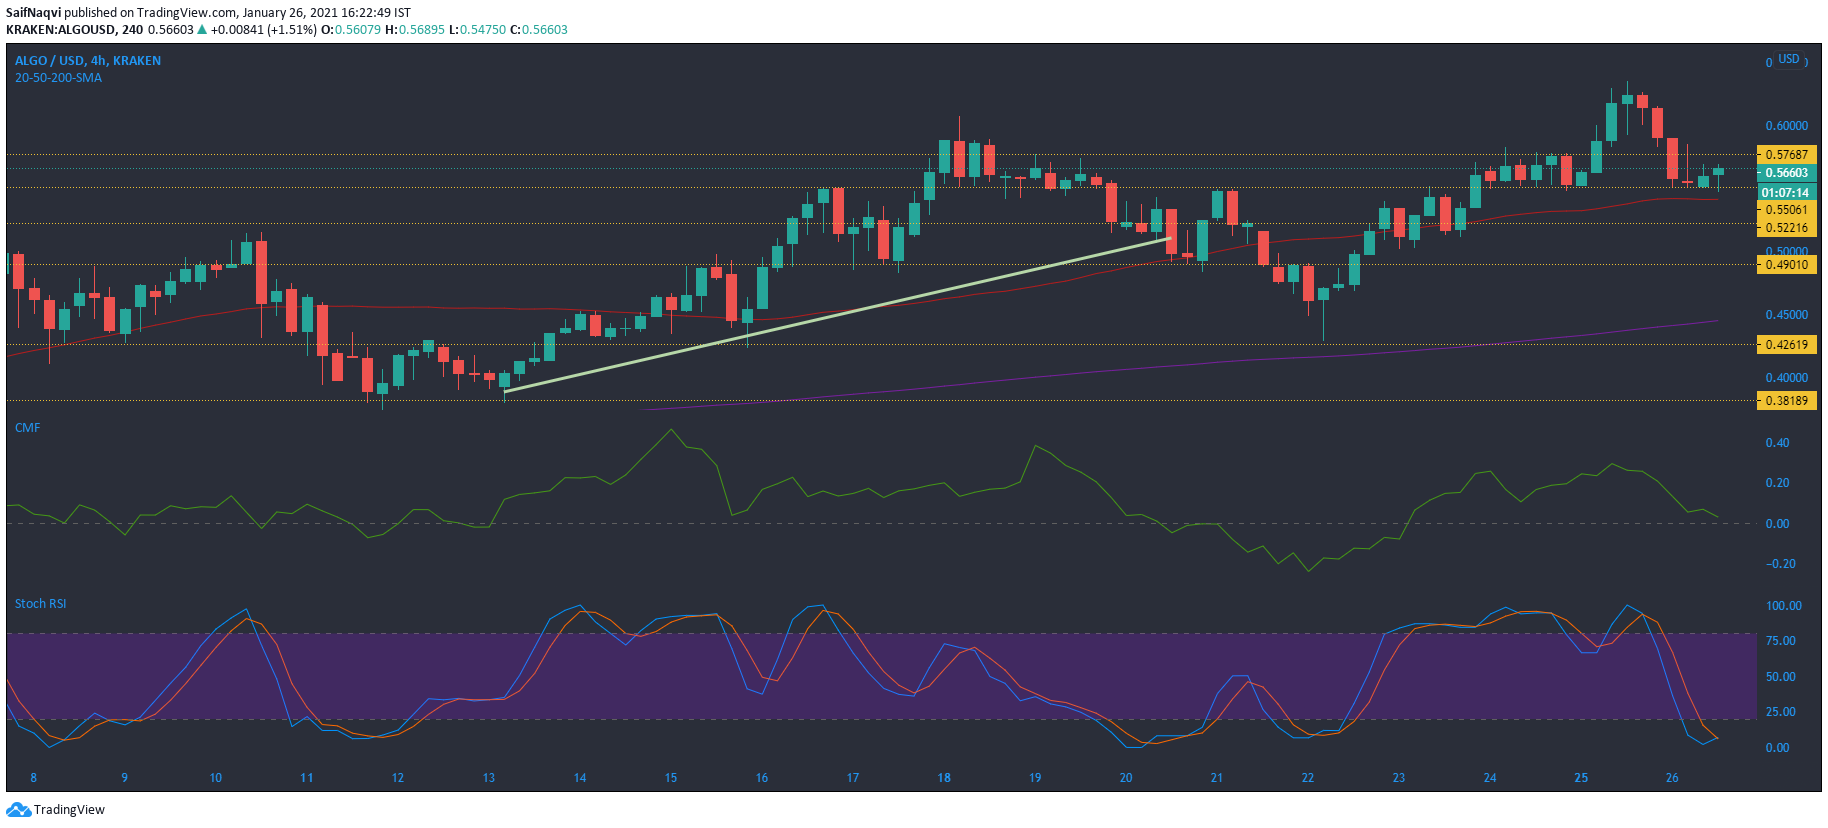
Algorand fell back below the $0.57-support level after a brief spike saw the crypto-asset snap a local high of $0.62. Despite the pullback over the last 24 hours, ALGO has been on an uptrend since the beginning of the year, with the price constantly hitting higher highs and higher lows. The uptrend also reflected in ALGO’s gains over the past 3o days, with the same observed to be a healthy 77%, at the time of writing. However, its short-term movement was unclear as the indicators gave mixed signals about the price.
While the Chaikin Money Flow was heading south to suggest that capital inflows into the market were on a decline, the Stochastic RSI was heading towards the oversold zone on the charts.
DigiByte [DGB]

Source: DGB/USD, TradingView
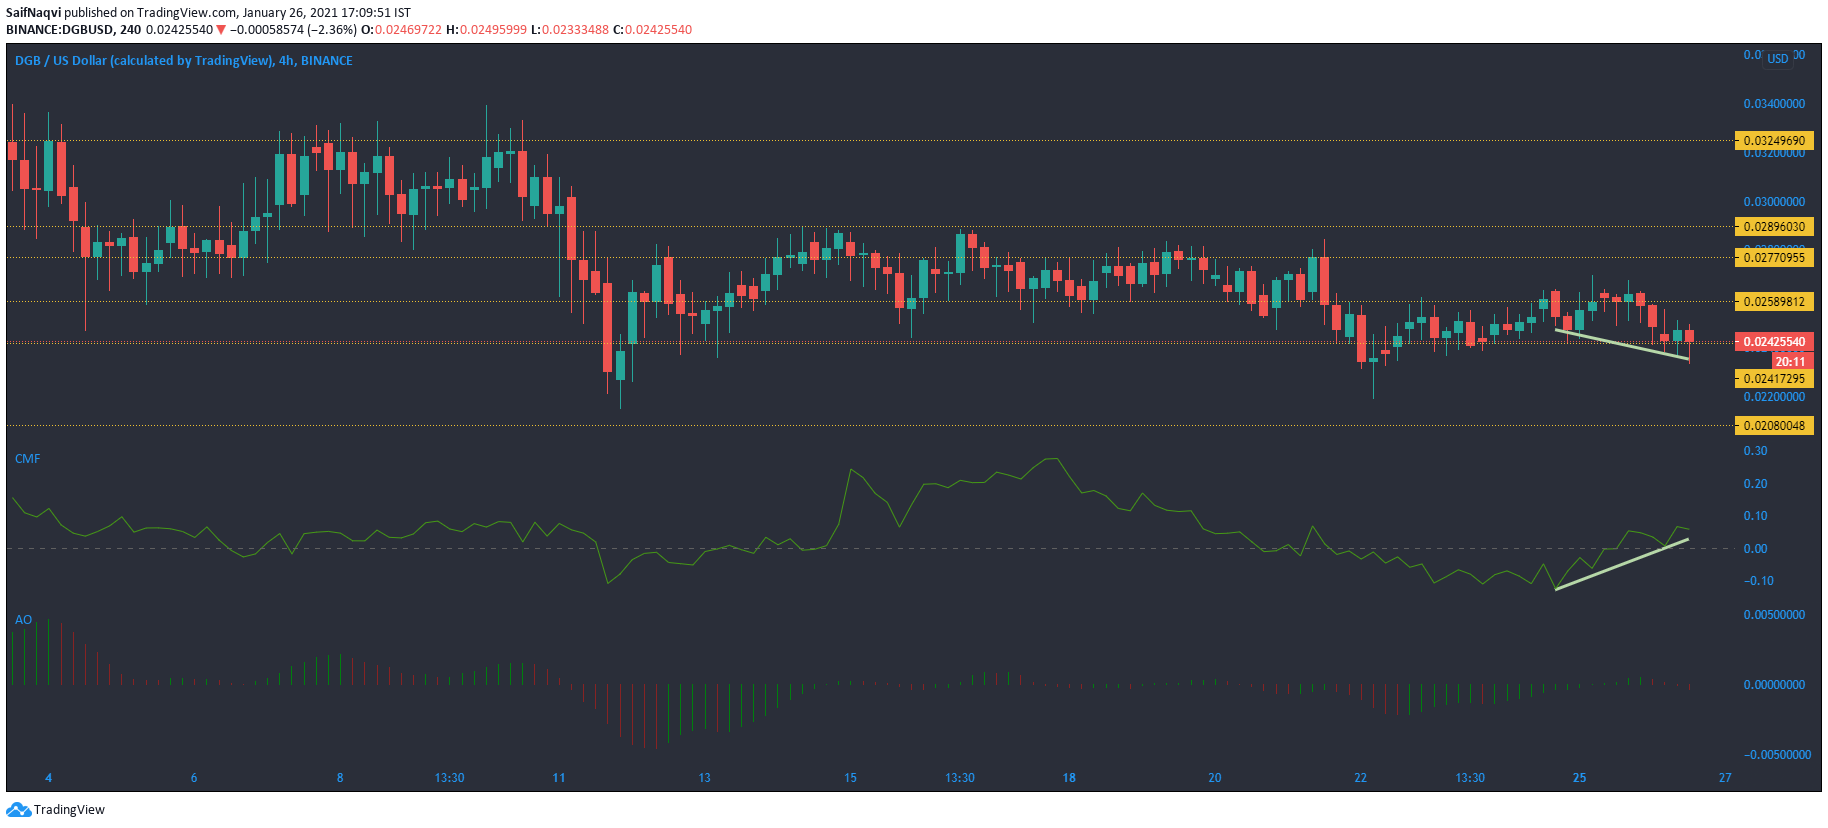
DigiByte seemed bearish on the charts, with the crypto being traded at $0.024 at press time. In fact, DGB was down by over 5% in the past 24 hours. However, a pickup in trading volumes and capital inflows over the last 24 hours could push the price towards its immediate resistance moving forward.
The Chaikin Money Flow formed a bullish divergence with the price and implied that low selling pressure was pushing the price lower and hence, a bounce was in order.
On the other hand, the Awesome Oscillator was slightly bearish, despite the indicator highlighting a lack of strong momentum on either side.


