Bitcoin Cash, Dogecoin, XRP Price Analysis: 31 May

Bitcoin Cash continued to trade within a symmetrical triangle and awaited a breakout. Dogecoin’s resilience was highlighted at $0.302-support. Finally, XRP looked to break north of its symmetrical triangle but a sturdy resistance mark lay around $1.03.
Bitcoin Cash [BCH]
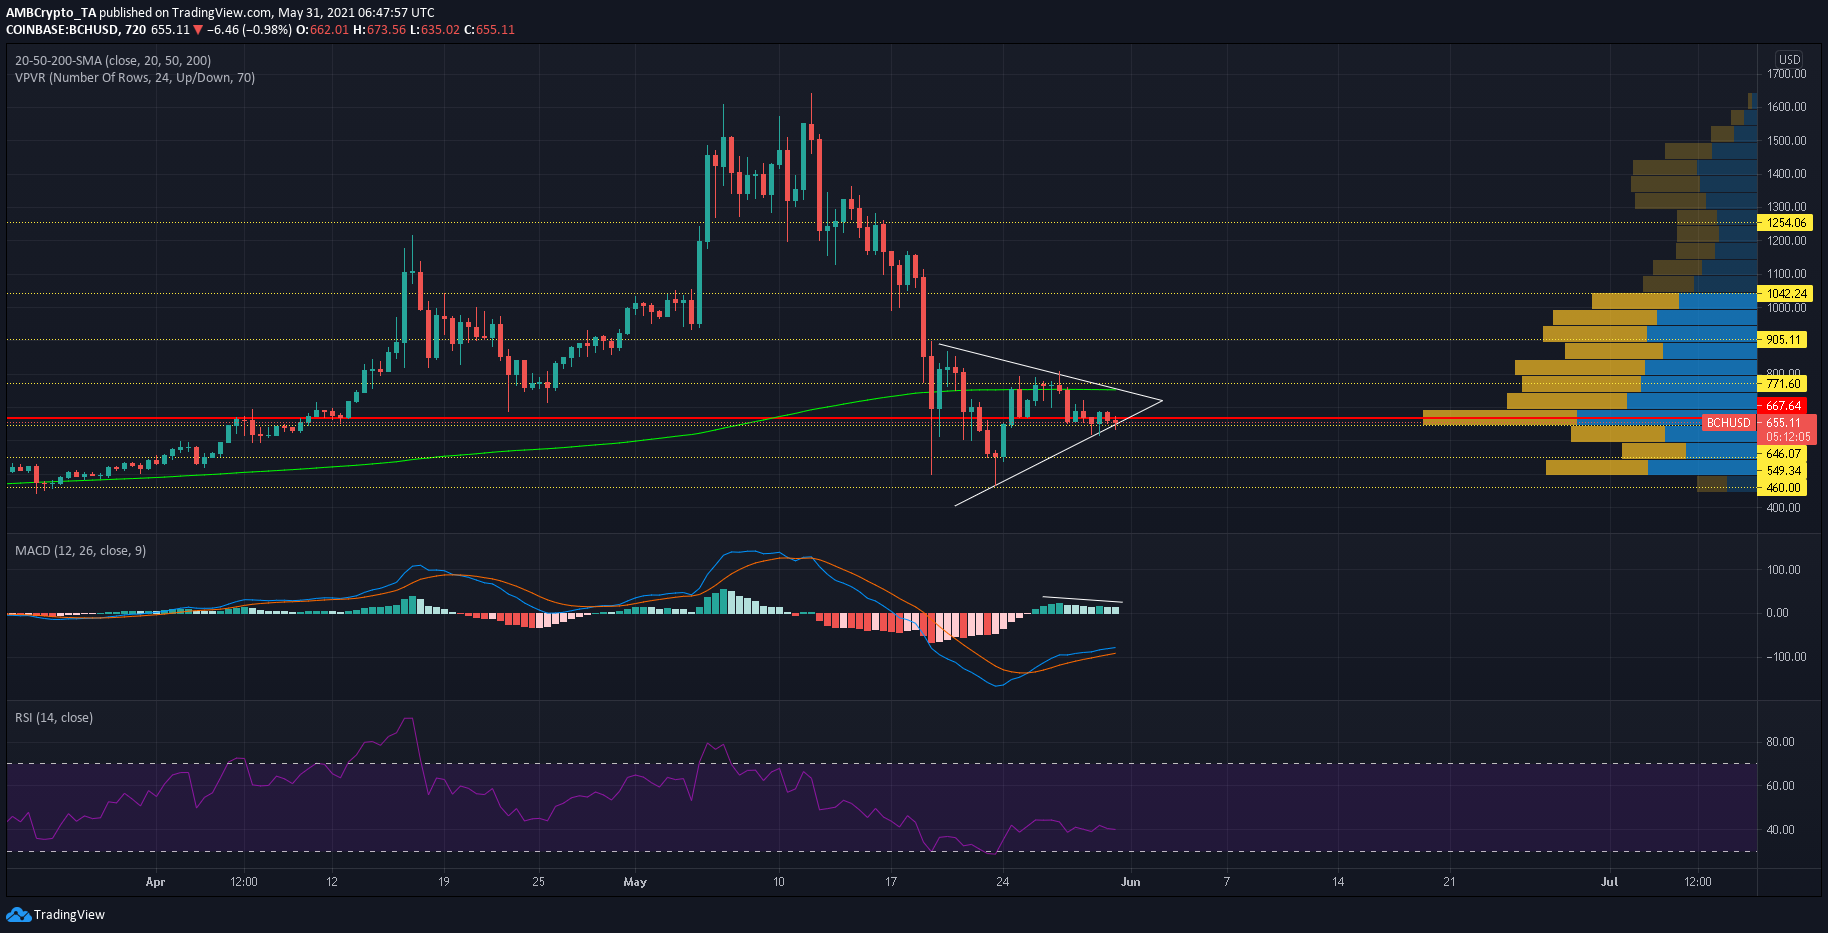
A previous analysis highlighted a symmetrical triangle but Bitcoin Cash was yet to break out from the pattern. A closer look at the Visible Range showed that the highest number of trades were initiated around $650- representing the lower trendline of the pattern. Hence, this area of support looked strong for BCH and there was a chance that bulls defend this zone from a breakdown. On the other hand, the upper trendline coincided with 200-SMA (green) which could act as a barrier in case of an upwards breakout.
MACD line did trade above the half-line, but the bulls were losing momentum according to the histogram. RSI was still in bearish territory- indicating weakness in the market.
Dogecoin [DOGE]
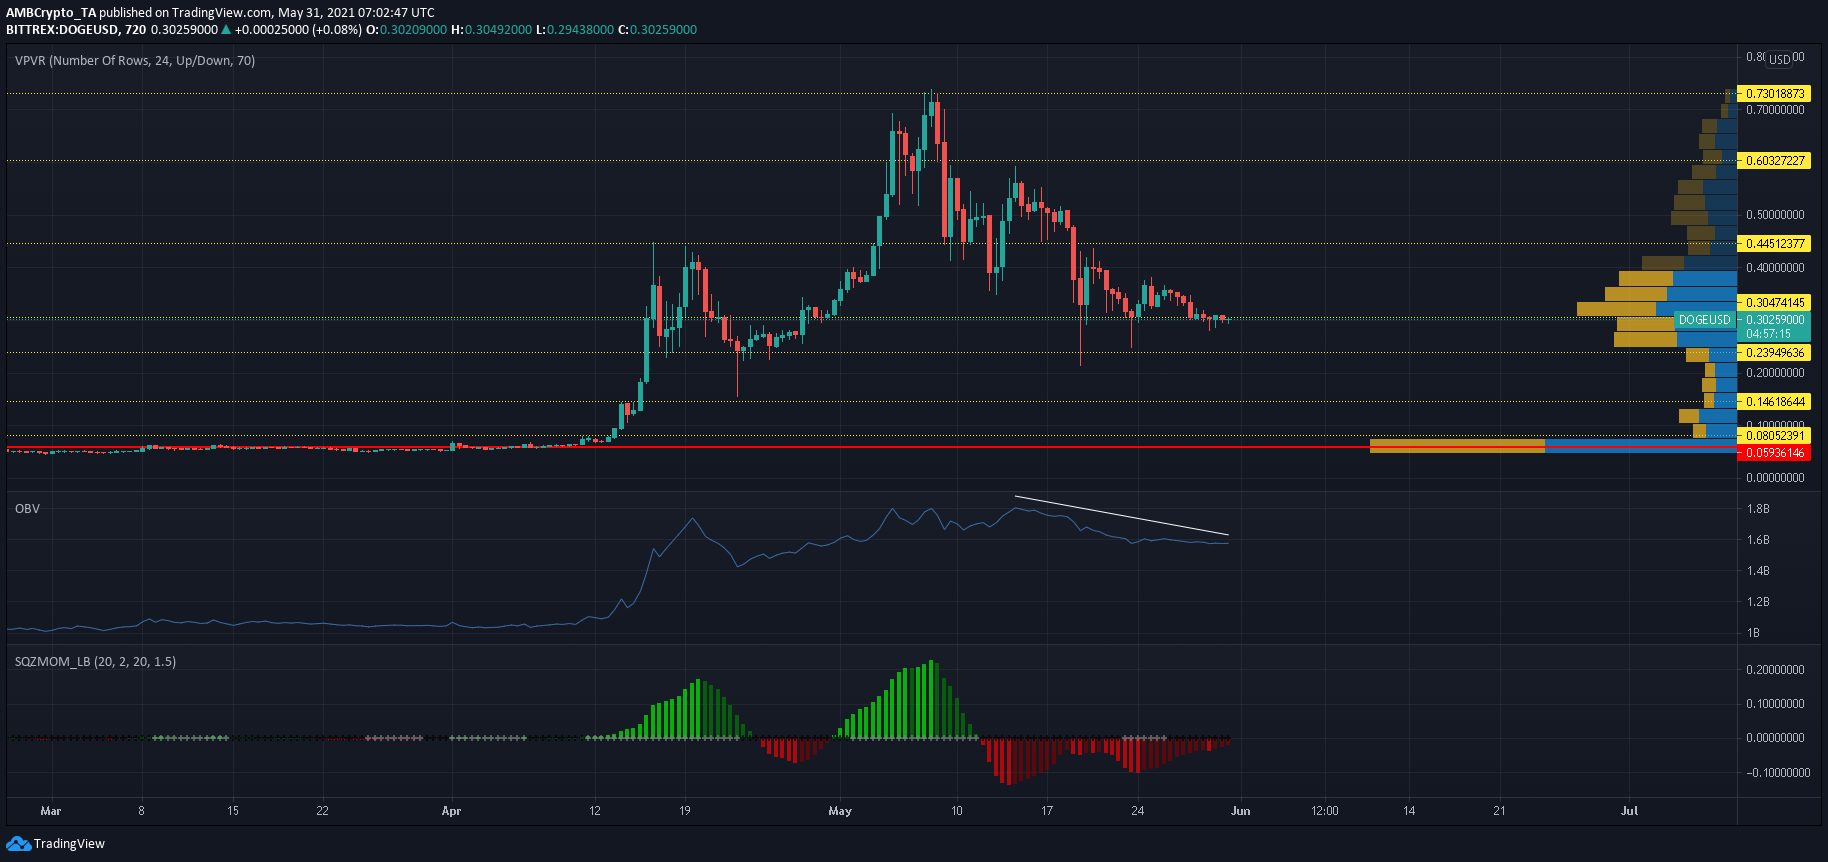
Visible Range on Dogecoin pointed out a fairly high number of trades placed around $0.302- making this region a critical area to watch out for over the coming days. OBV’s lower highs have indicated selling pressure in the DOGE market, and it would be interesting to see if this is countered at the present support mark. In case of a breakdown, levels mentioned in an earlier analysis may come to light.
However, Squeeze Momentum Indicator noted decreasing bearish momentum over the past few days. The first few green bars followed by white dots would indicate a ‘squeeze release’ and allow for sharper gains.
XRP
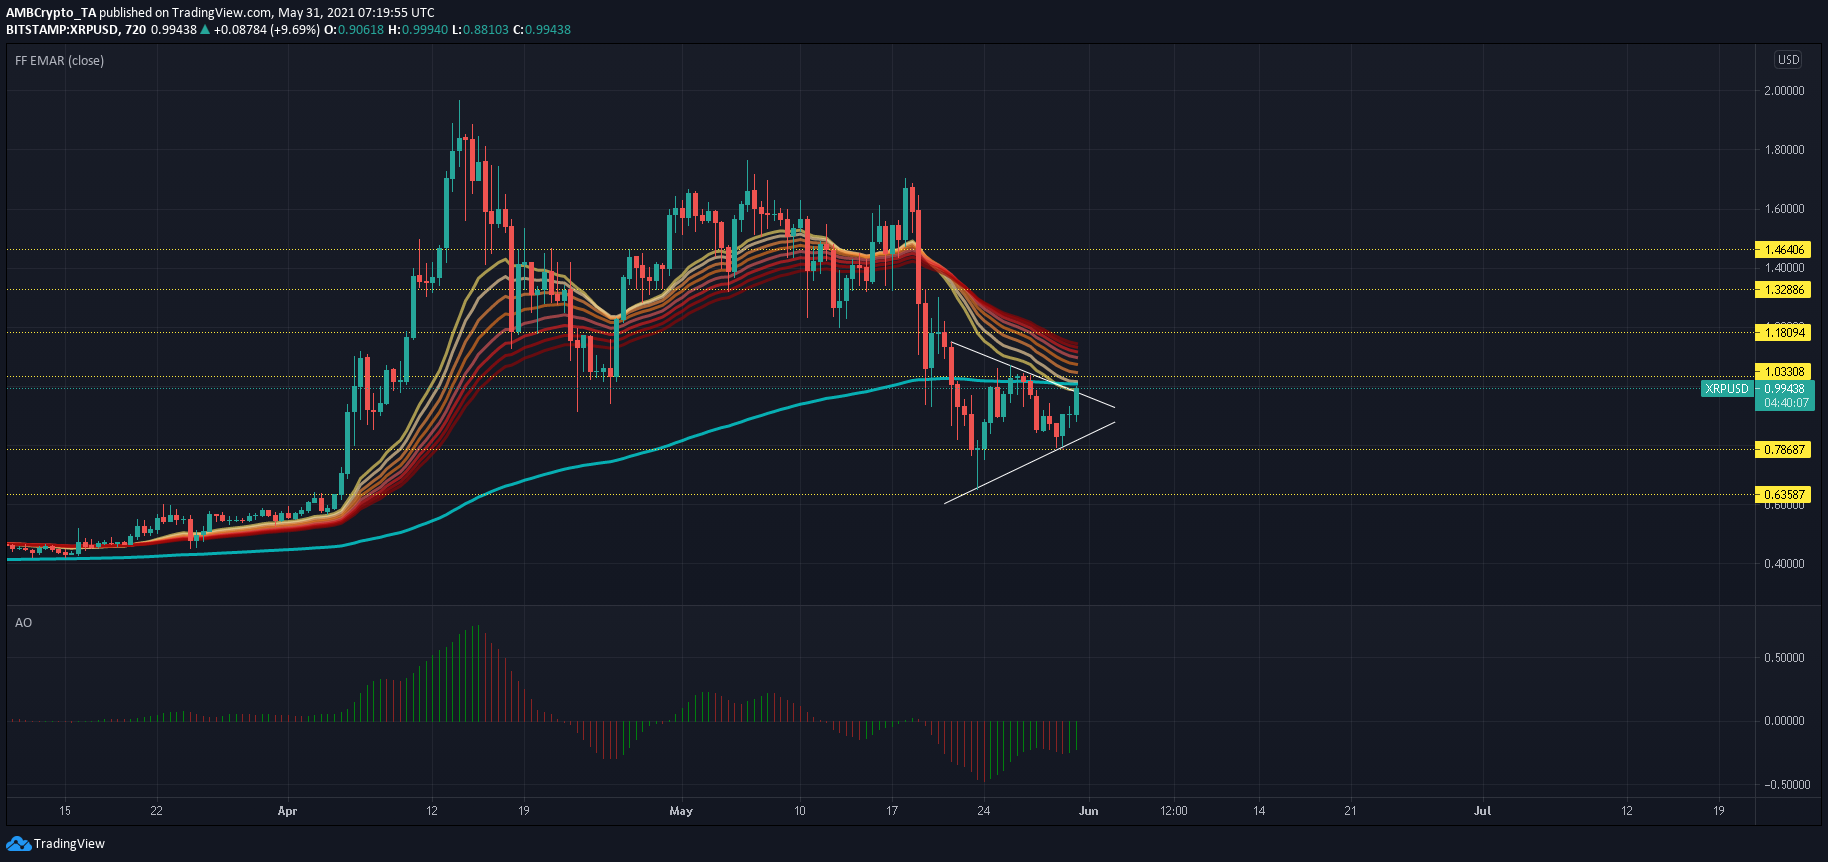
XRP bounced back from its lower trendline and looked to break above its symmetrical triangle at the time of writing. Areas to watch out for in case of a favorable outcome include $1.18 to $1.32. Awesome Oscillator showed that buying pressure was yet to fully materialize, but a bullish twin peak setup was a positive sign.
Interestingly, EMA Ribbons moved just above the upper trendline on XRP’s pattern and some resistance could be met at $1.03. This area also coincided with 200-SMA (light blue). Reclaiming this critical area would be an important development over the coming sessions.