Bitcoin Cash eyes pickup at this near-term support zone

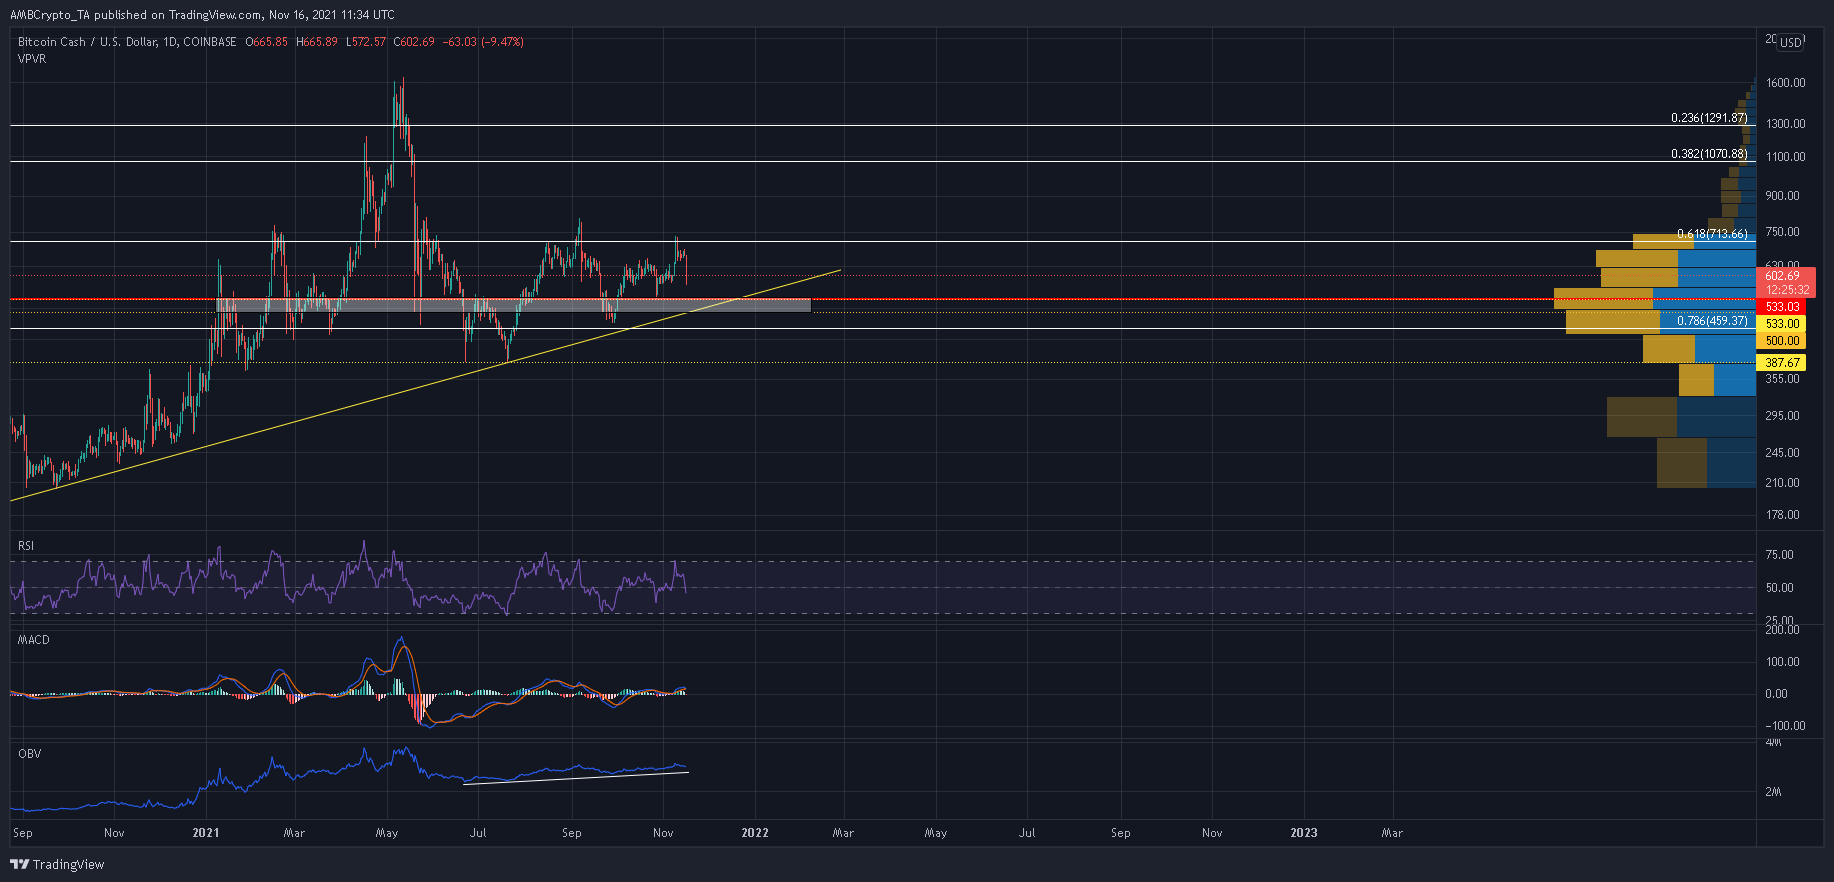
Hit by a 12% drawdown over the last 24 hours, Bitcoin Cash fell prey to a correction in the broader market. On the charts, BCH projected a new low at a bottom sloping trendline due to red flags present on the daily RSI and MACD.
However, a bullish rebound was expected between $533-$503. The same could also pave way for a breakout above the 61.8% Fibonacci level once shorts are liquated.
Bitcoin Cash Daily Chart
Bitcoin Cash was set to tag its lower sloping trendline following a weak RSI, and sell signals present along the MACD. The trendline, which has extended since September 2020 has had a single point of contact in 2021 so far, with BCH testing its defenses during late-July.
A move into the support zone of $533-$500 could initiate new longs as investors grab BCH at a discounted level. Furthermore, the Visible Range’s POC at $533 would help cushion an extended decline. Once a rebound is established, expect BCH to retake lost ground and eye the 61.8% Fibonacci level.
The On Balance Volume’s upwards trajectory did suggest that buying pressure has been building up since late-June and an upwards breakout seemed like a certainty once selling pressure is relieved. On the other hand, a close below the aforementioned support and the 78.6% Fibonacci level would put BCH in dangerous waters. A demand area at $387 would be called into action if BCH extends losses over the coming days.
Reasoning
BCH’s near-term outlook was backed by its RSI and MACD. This RSI had just weakened below 50 and was headed into bearish territory. Such readings often allow traders to enter short positions as well. Moreover, a bearish crossover along the MACD threatened a decline below the half-line.
Conclusion
BCH could extend losses between $533-$500 and set a new bottom at its lower trendline. From there, expect bulls to contain selling pressure and prepare for an upwards move. A breakout above the 61.8% Fibonacci level would see BCH move past a chunk of selling pressure, from where it can close the gap to its May local high at a faster rate.


