Bitcoin Cash: How far will BCH go in search of demand?

Disclaimer: The findings of the following analysis are the sole opinions of the writer and should not be considered investment advice
Bitcoin Cash has seen pretty low trading volume over the past few days, according to data from Messari. This suggested a lack of interest in the coin, and unless this trend changes, sideways movement on the charts could become the norm. Establishment of the next strong trend depends on two levels on the chart and could take a long while.
Until such a breakout, the range presented over the past few months can be exploited.
Bitcoin Cash – 1 Day Chart
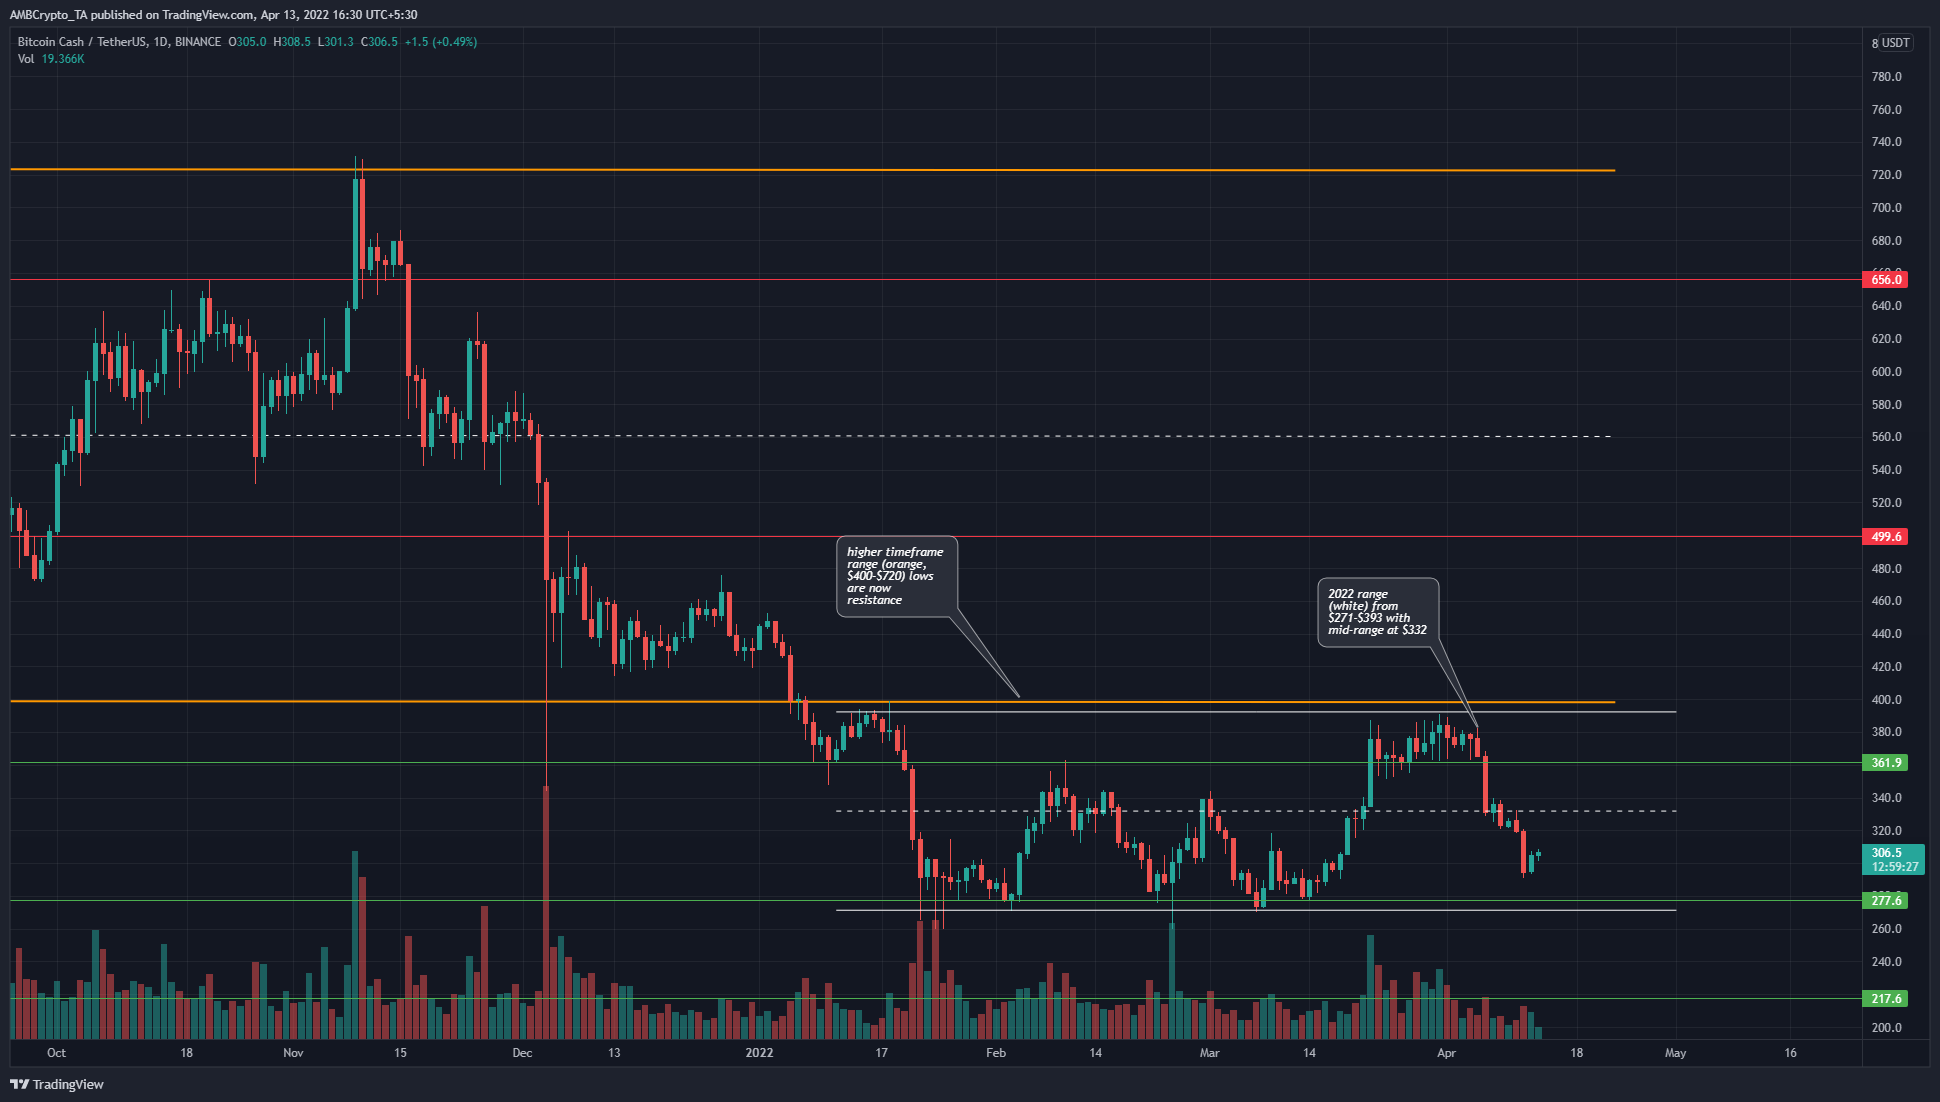
In November, BCH was trading at range (orange) highs of $720. This was at a time when Bitcoin formed a swing high and ATH at $69k and began its descent. The downtrend of Bitcoin Cash went hand in hand with Bitcoin’s descent to $33.2k.
Over the past three months, BCH appeared to have stalled the former downtrend. In doing so, another range from $271-$393 was established. The mid-point of this range lay at $332, and would likely offer some resistance to the bulls.
If Bitcoin Cash visits the $260-$277 area, it could be a buying opportunity for traders with a longer timeframe. They would target the range highs at $390 as a take-profit level.
Rationale
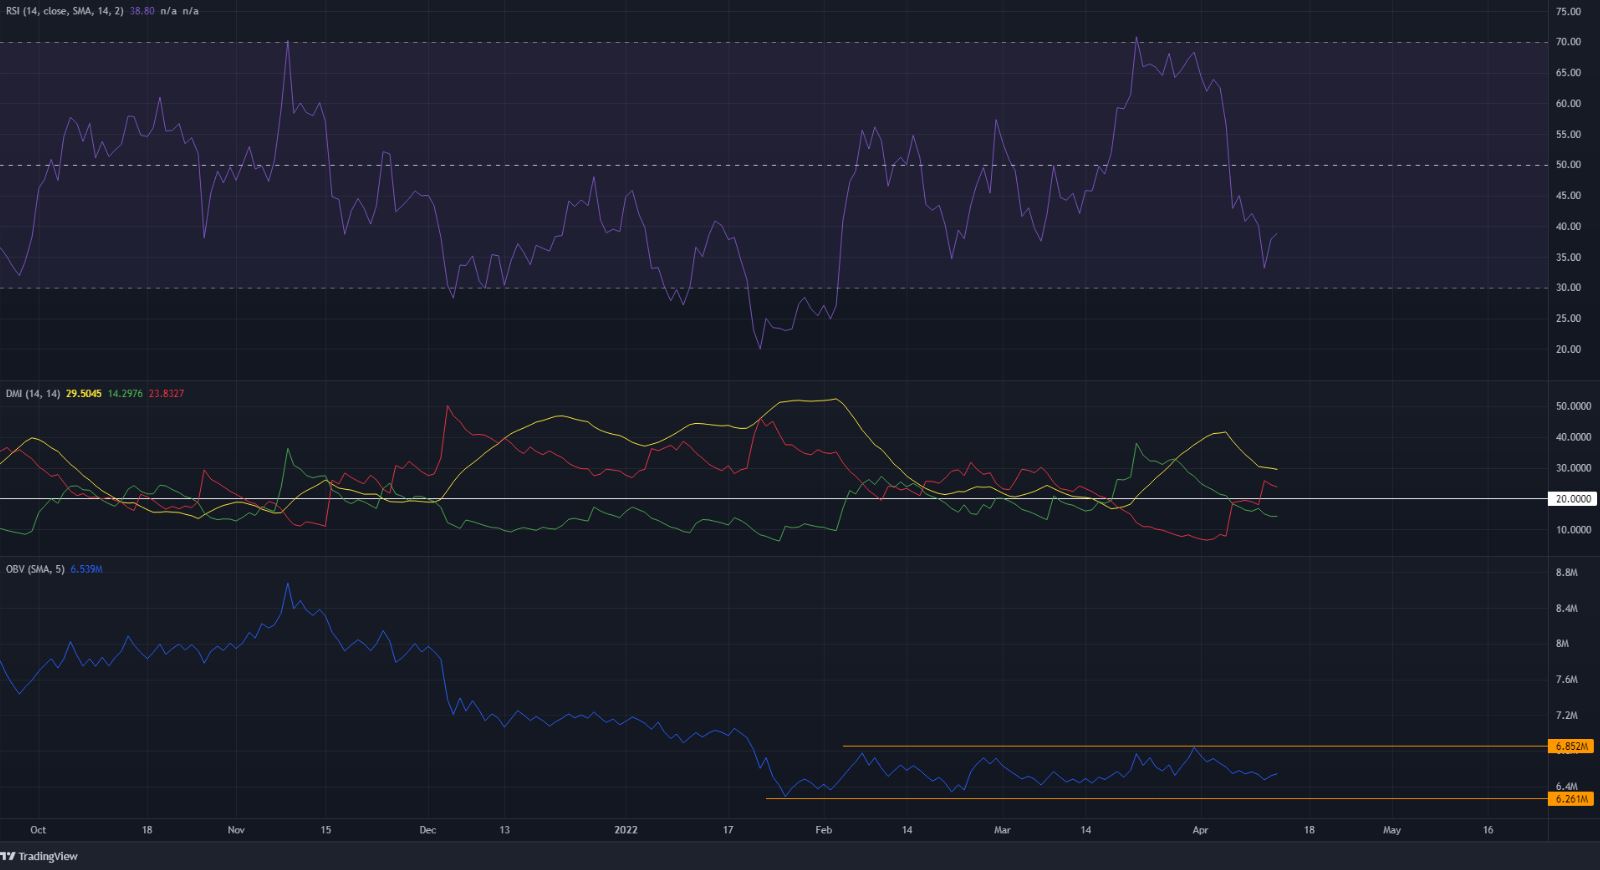
The RSI pictured strong bearish momentum at press time, in response to BCH’s drop from $380 over the past two weeks. However, the RSI did not suggest that a strong trend in either direction had been established.
The DMI, on the other hand, did show a significant bearish trend in progress on the daily timeframe, with both the ADX and the -DI (yellow and red respectively). The OBV agreed with the RSI and the price action more than the DMI, as the OBV also appeared to be stuck within a range.
Conclusion
Neither the buyers nor the sellers were dominant, according to the OBV. The price action showed that a range had been established, and a retest of the $277-level could be a buying opportunity.
However, BCH could dip as low as $260 in search of liquidity. What this means is that buys have to be carefully managed.


