Bitcoin Cash, IOTA, Compound Price Analysis: 18 January

Bitcoin Cash and IOTA were primed for a breakout as they formed a triangle pattern on declining trading volumes. Compound flipped the $211 level to support and was headed towards $250.
Bitcoin Cash [BCH]
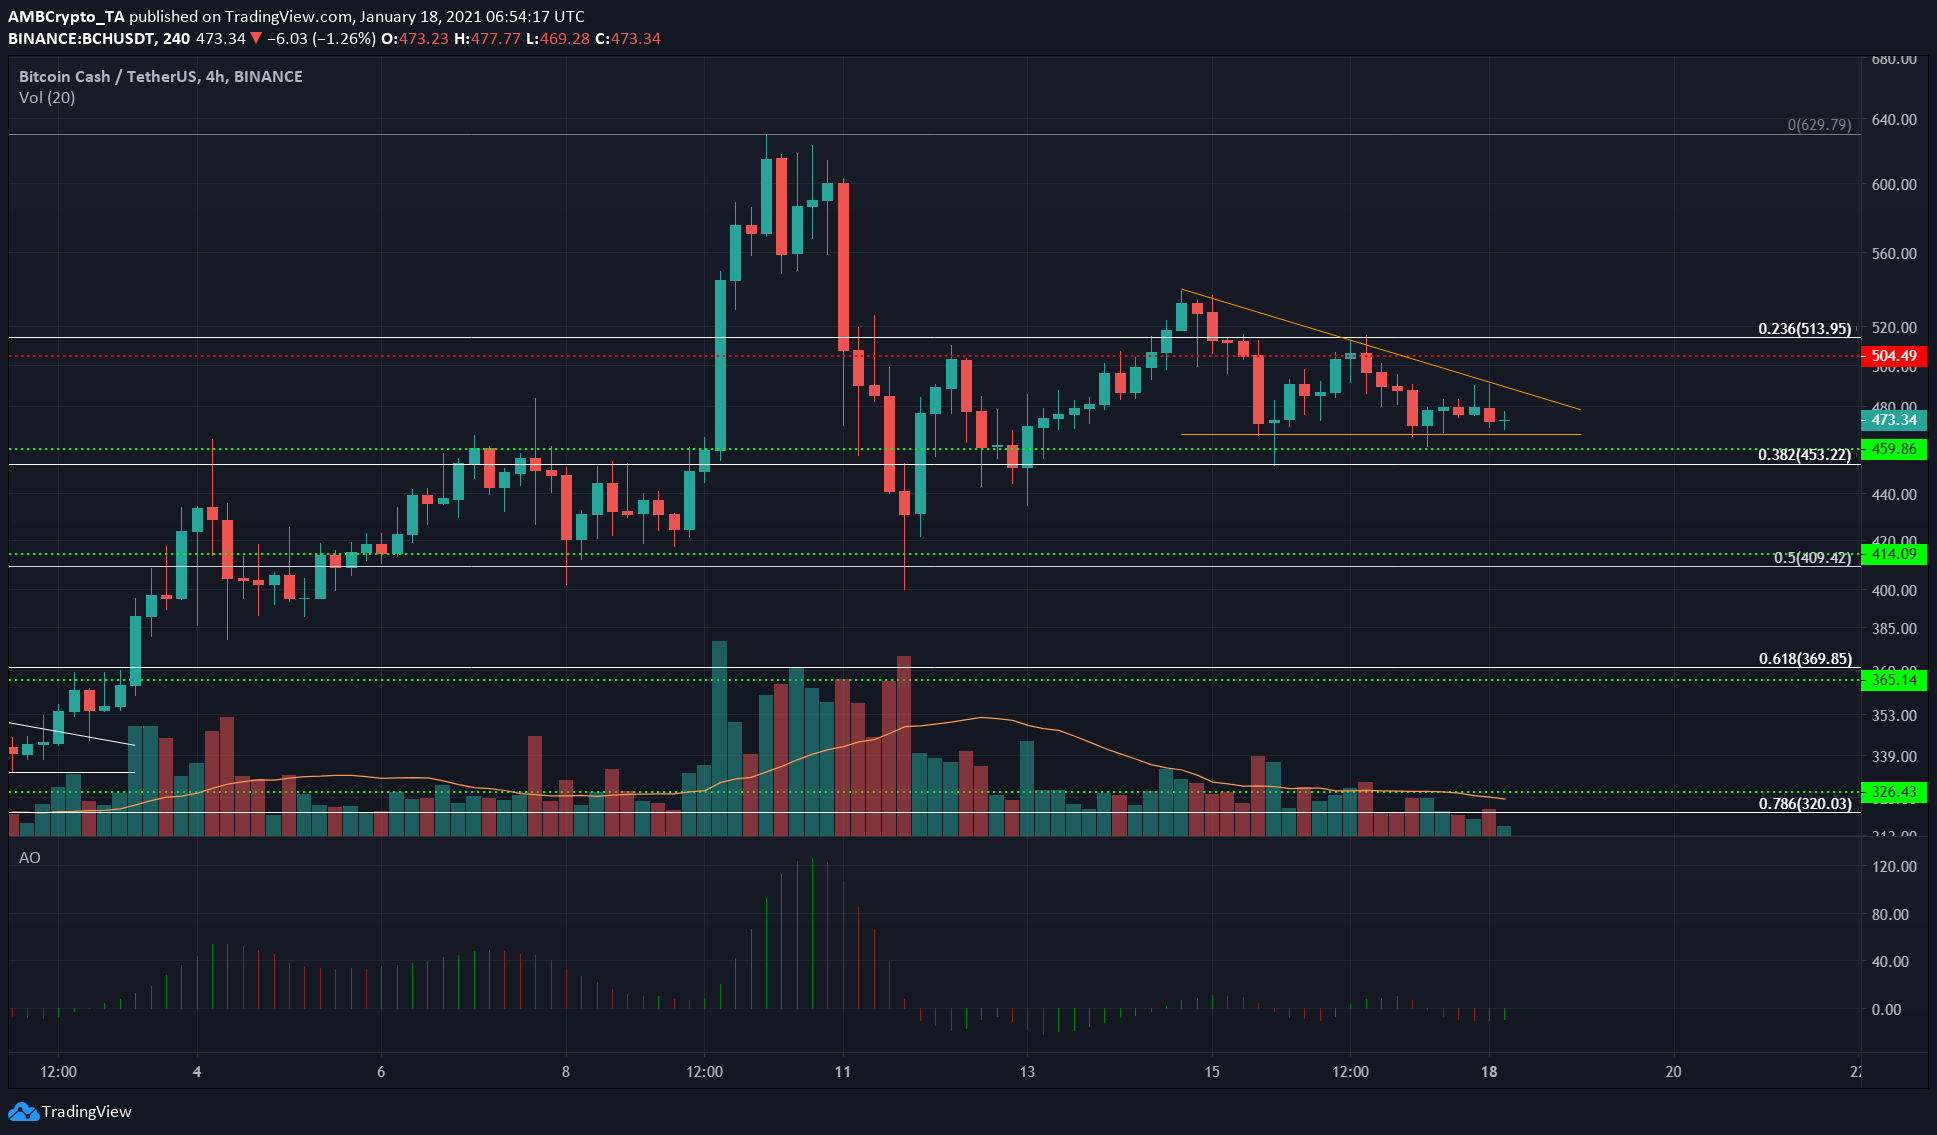
Over the past few days, the trading volume has been declining while BCH formed a triangle pattern and was poised for a breakout. At the time of writing, it was trading at $473 and had a level of support at $459 and a level of resistance at $504.
The Awesome Oscillator showed that momentum had been neutral for BCH recently, and the market appeared to be waiting for a breakout. Over the next few hours, the trading volume would be the most important indicator to point toward a breakout.
IOTA
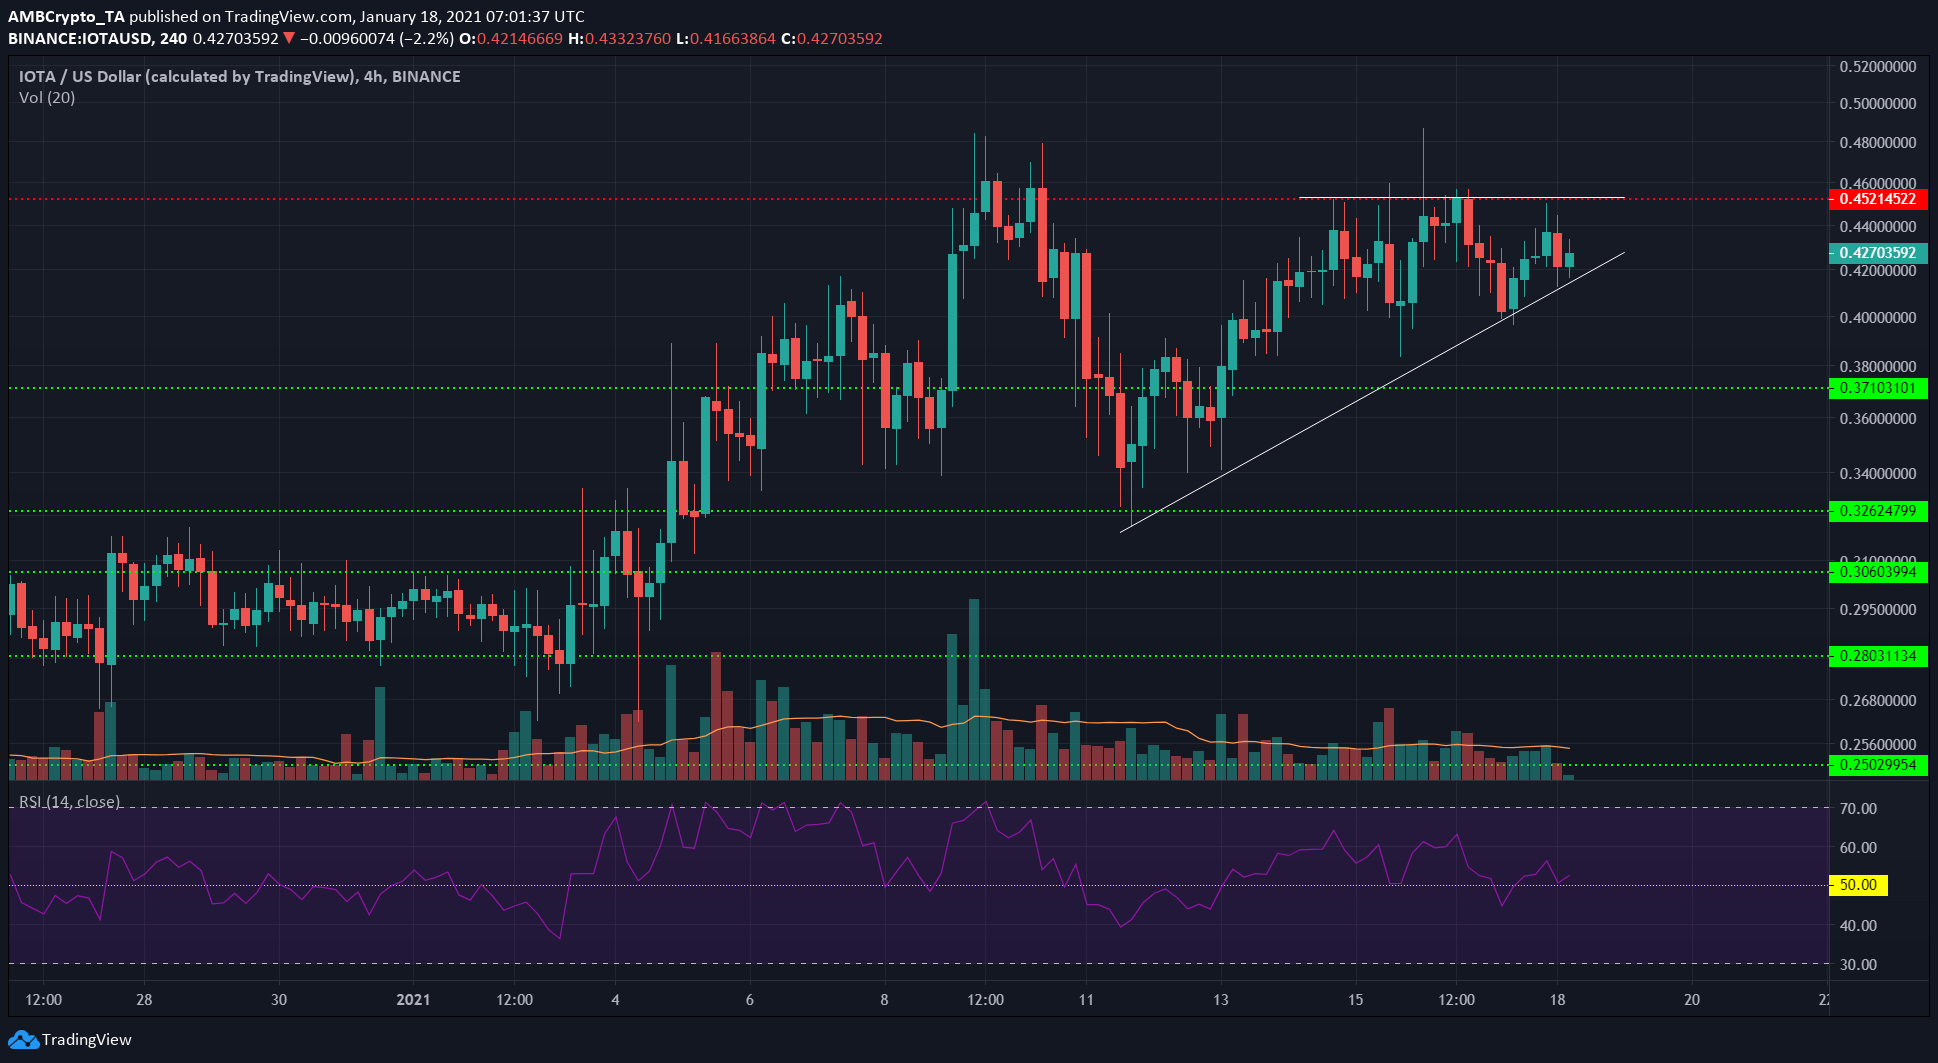
In a similar fashion to BCH, IOTA also anticipated a breakout. An ascending triangle pattern was formed on the charts, with declining trading volume over the past few days. This pattern generally sees a breakout to the upside. Beyond $0.45, the next levels of strong resistance lie at $0.5 and $0.54.
The RSI bounced weakly off the neutral 50 line, and while the momentum is marginally in favor of the bulls, this could change quickly if IOTA slips beneath the lower boundary of the triangle.
The next level of support for IOTA in the event of a drop is $0.37.
Compound [COMP]
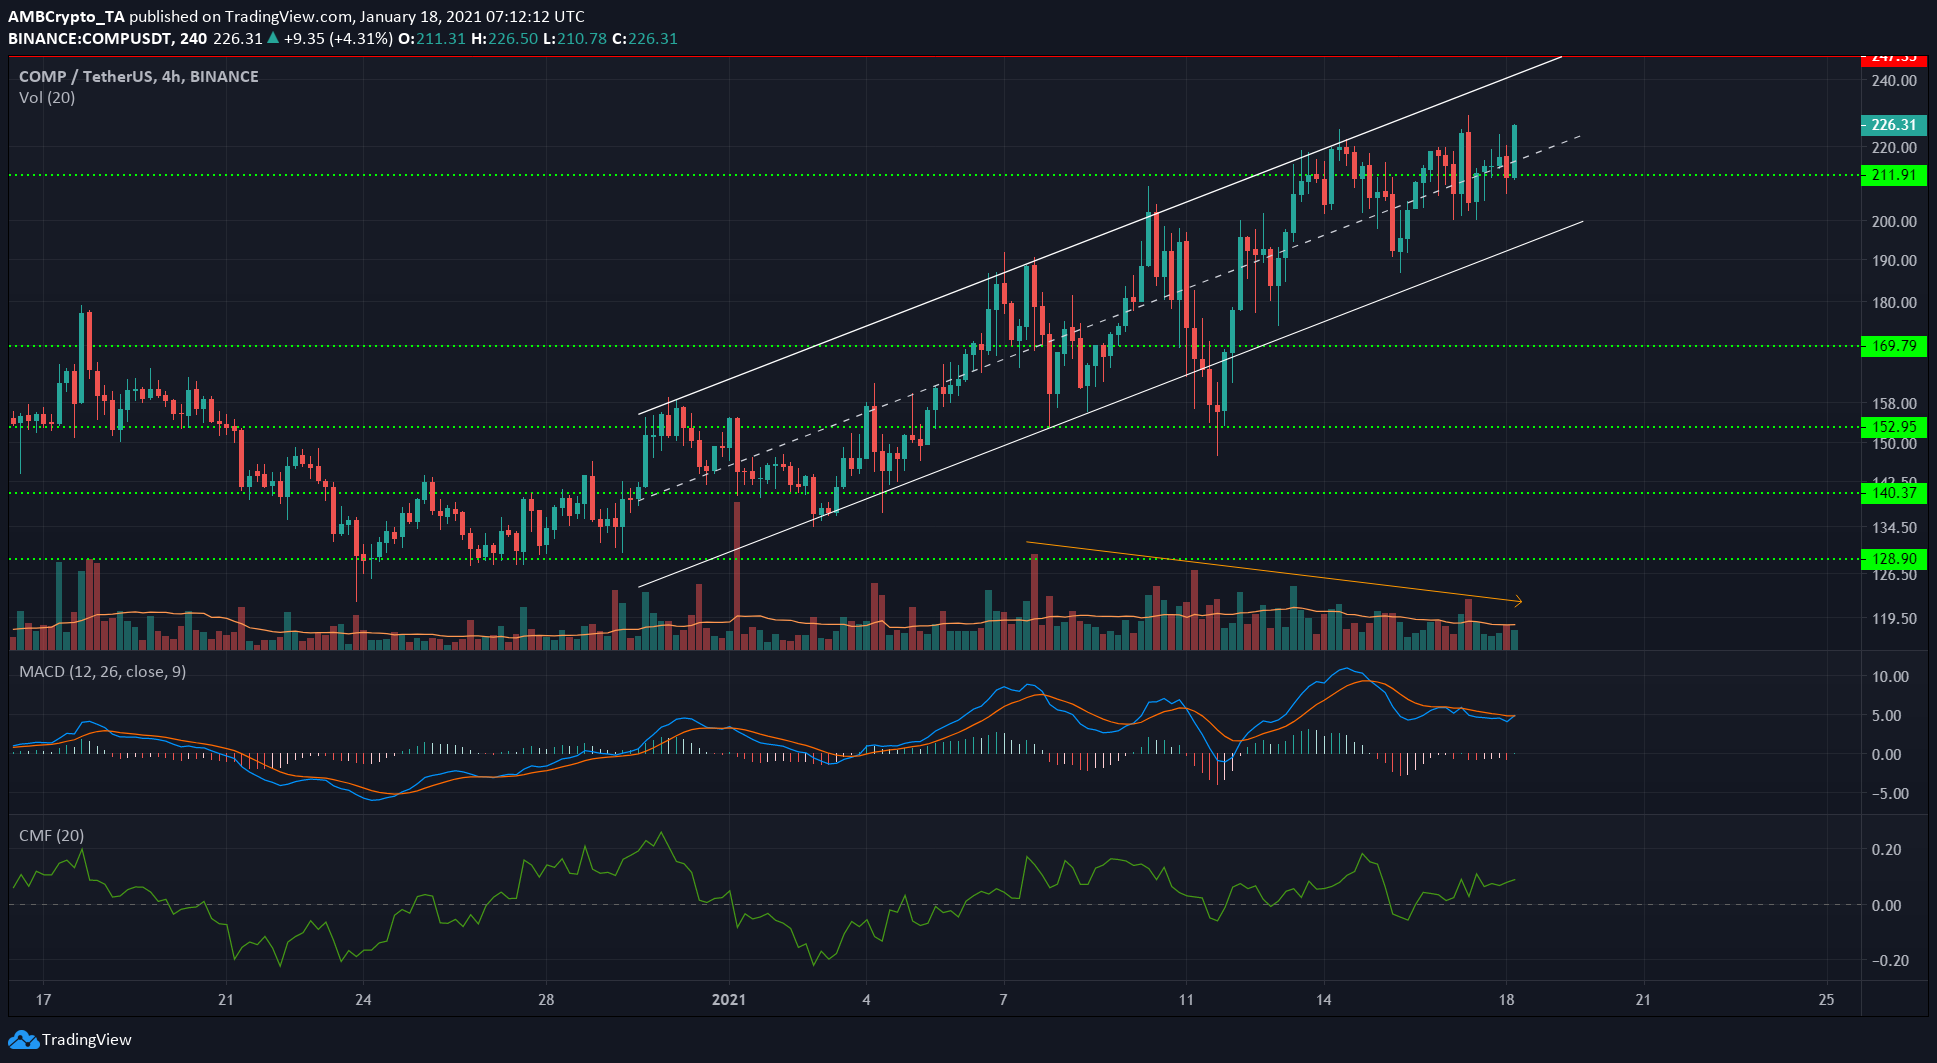
Compound sent some mixed signals. The price action showed COMP forming an ascending channel. While this can be a reversal pattern, COMP flipped a level of resistance to support and surged higher over the past few hours.
The MACD was on the verge of forming a bullish crossover above the zero line, and would indicate strong bullish momentum if it does,
The Chaikin Money Flow indicated net capital flow into the market, highlighting demand from buyers.
Yet, the trading volume has been steadily falling even as the price rose. Not shown here but noted in a previous analysis, the OBV showed steady selling pressure on the asset, even though its prices continued to trend upward.


