Bitcoin Cash, MANA, Sushi Price Analysis: 03 March

After observing a rising wedge breakdown on its 4-hour chart, Bitcoin Cash bulls needed to defend the 50 EMA to hold their grounds. Further, MANA continued to face a hurdle at its supply zone while its technicals displayed decreasing buying influence. Also, Sushi endeavored to cross its 20 EMA while exhibiting an advantage for the bears.
Bitcoin Cash (BCH)

As the bearish phase heightened, BCH sharply fell and lost its year-long support (now resistance) at the $387-mark. After a nearly 28% retracement (from 10 February), the alt matched its January lows. BCH oscillated between the $387-$260 range for over seven weeks.
The latest retracement saw a down-channel (yellow) that yet again tested its 15-month support at the $260-floor. As a result, the price reversed and went up by more than 31% before pulling back from the rising wedge (white). Now, the 50 EMA (cyan) confluences with the horizontal $216-mark to form immediate support.
At press time, BCH traded at $317.5. After nosediving from the 70-mark, the RSI took a break below the equilibrium, but the 47-support stood sturdy. Furthermore, the DMI lines took a bearish crossover. But its ADX still stood fairly weak, revealing a weak directional trend.
Decentraland (MANA)

Since touching its 11-week low on 22 January, the alt saw a staggering 107.4% ROI until 9 February. Post which, it dropped below crucial price points.
Over the past few days, MANA grew in a rising wedge on its 4-hour chart. The Supply zone (rectangle) created after the recent sell-off still stood strong as the alt struggled to cross the $2.7-mark. Now, any close below the wedge could lead to a $2.5 retest.
At press time, MANA traded at $2.69. The RSI continued its growth in the up-channel. However, it was challenging to stay afloat above the midline after the recent fall. Also, the MACD histogram fell below the zero-line, revealing decreasing buying momentum.
SUSHI
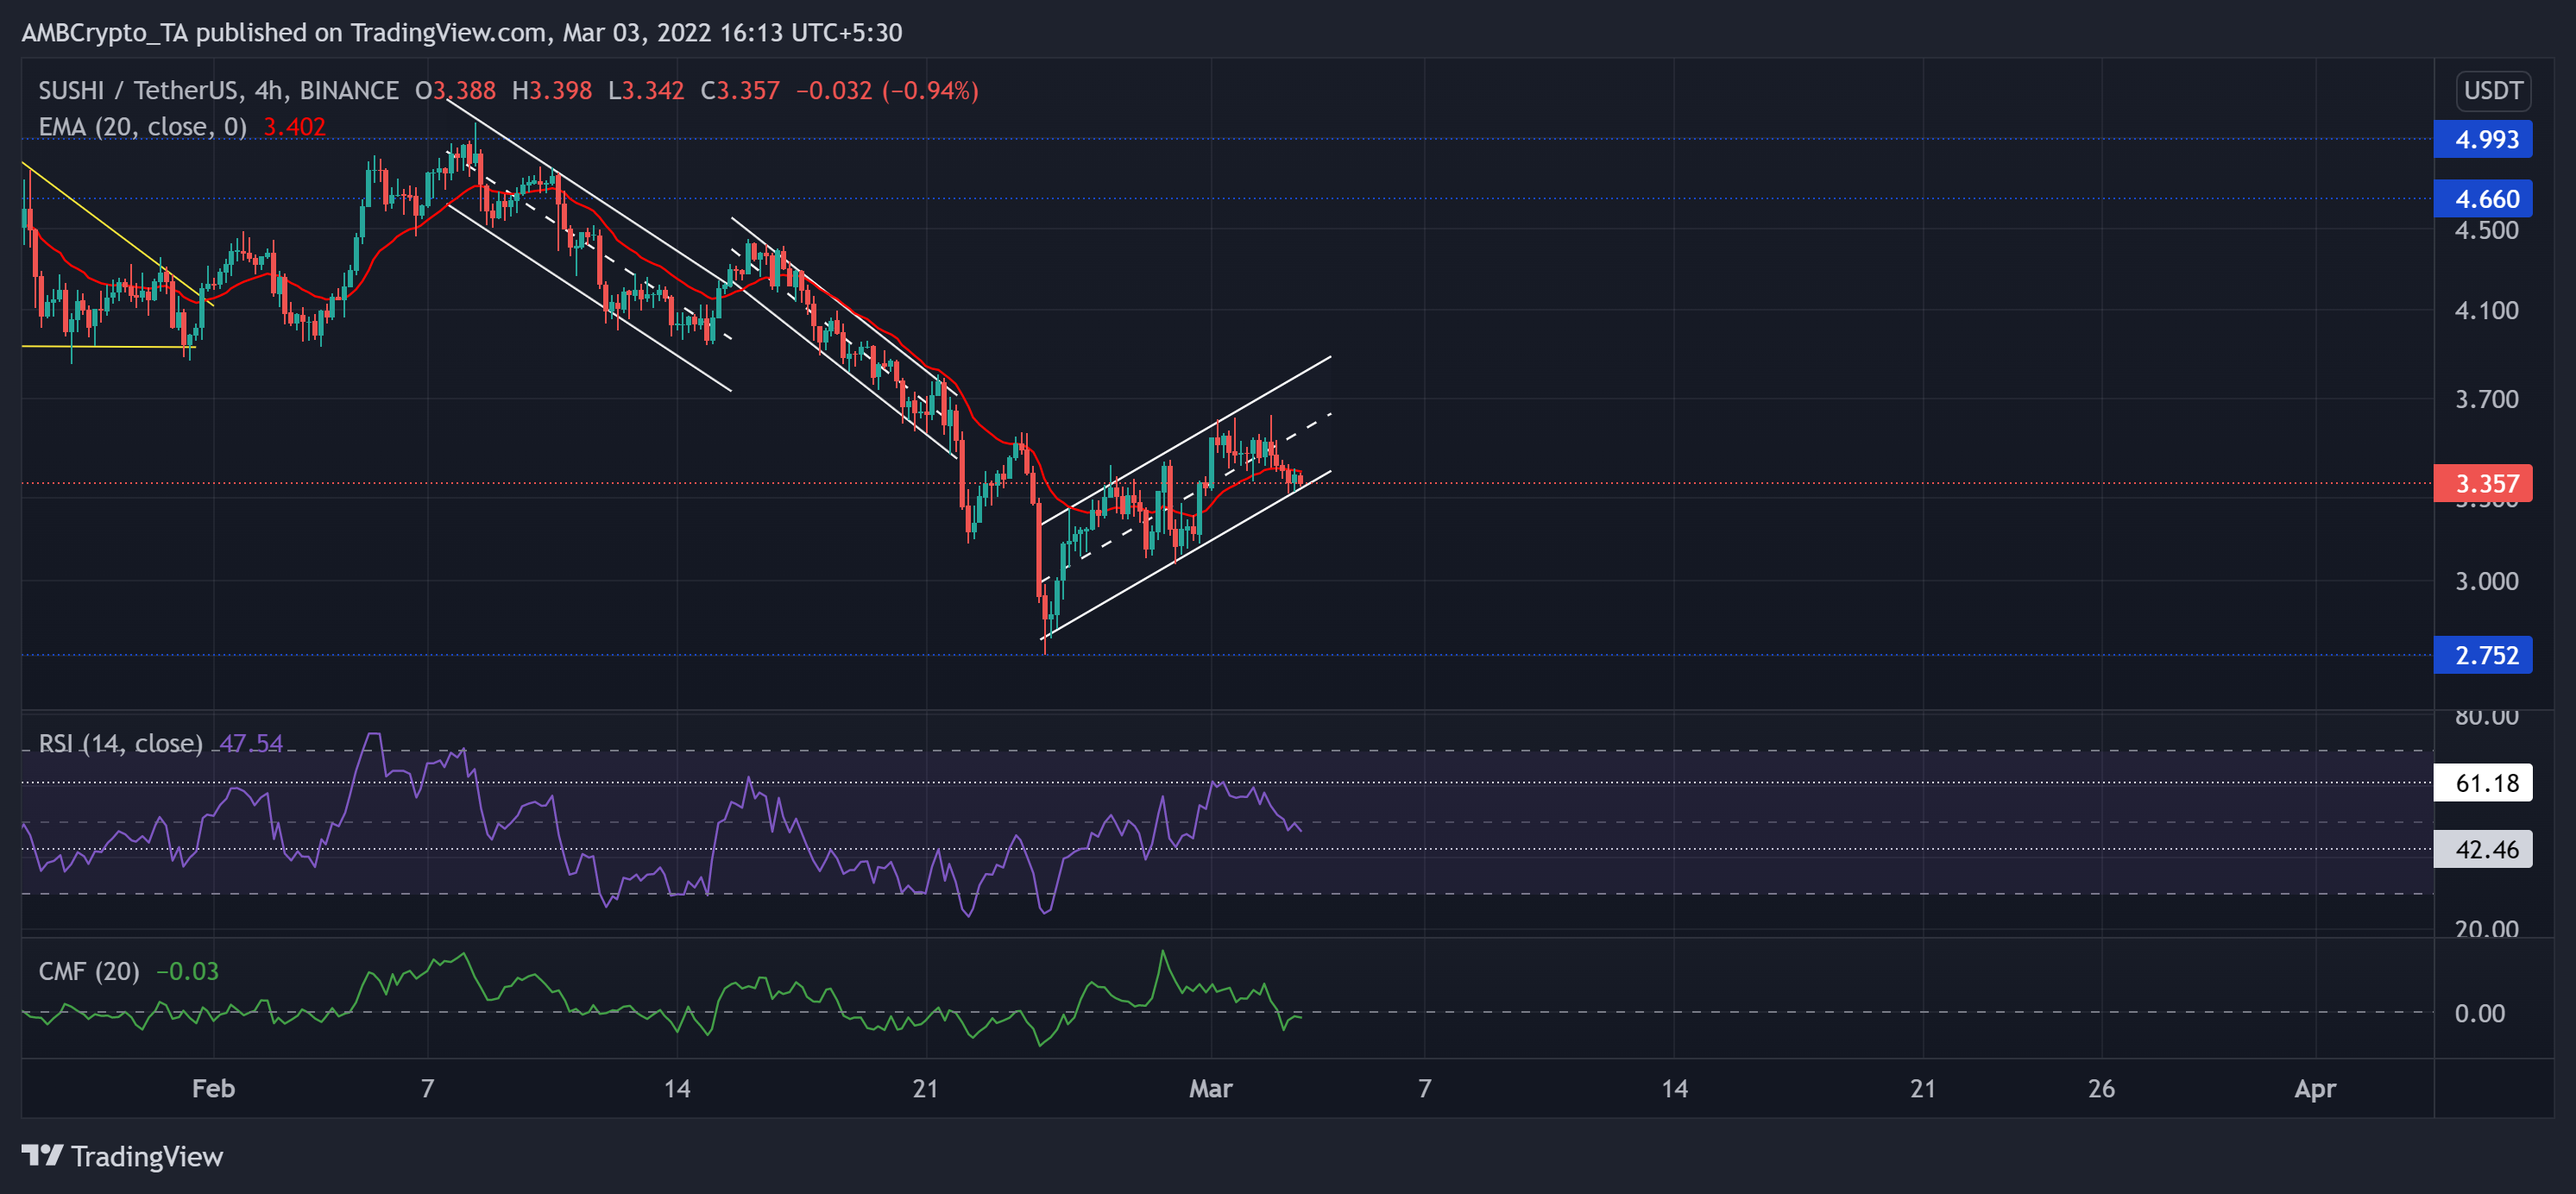
Since 8 February, SUSHI retreated in two down-channels (white) on its 4-hour chart and flipped the 20-EMA (red) from its support to resistance. As a result, SUSHI marked a nearly 45% retracement since then and poked its 14-month low on 24 February.
Even though the recent revival witnessed an up-channel, SUSHI found it challenging to overturn the 20 EMA. This trajectory confirmed the increasing bearish vigor. Now, the bulls needed to defend the lower trendline of the channel to prevent a further breakdown.
At press time, SUSHI was trading at $3.357. The RSI recovered but still failed to cross the 61-hurdle. It skewed in favor of the sellers after a 12 point plunge over the last day. Moreover, even the CMF declined below the half-line, indicating a slight bearish edge.


