Bitcoin Cash, NEM, Dash Price Analysis: 03 February

With market leaders Bitcoin and Ethereum rising by 7.6% and 11.9%, respectively, at the time of writing, altcoins such as Bitcoin Cash, NEM, and DASH rode the bullish wave and recorded gains on the charts. However, BCH and NEM formed bearish divergences and were predicted to fall in the short-term, barring a further rally in the broader market.
Bitcoin Cash [BCH]

Bitcoin Cash surged by over 5% and was trading at $442, at press time. Buying activity ticked up over the past few trading sessions as the bulls targeted a move above the $450-resistance level. A break above the aforementioned resistance level would present the next target at $468.
The Relative Strength Index closed in on the overbought territory as the index moved north. However, there was some skepticism in the market as a bearish divergence was spotted on the Chaikin Money Flow. In the event of a fall, the market’s bears could target the support level at $403.5. Nevertheless, the bearish predictions would be negated if the broader market rally continues to push altcoins north on the charts.
NEM [XEM]

A hike of 22% over the past few days saw NEM challenge the resistance at $0.281. The crypto’s price was rejected at this level as some bearishness was noted over the last few hours of trading. In fact, much like its counterpart BCH, NEM formed a bearish divergence which was evident on the Relative Strength Index. The RSI also pointed south from the overbought territory and suggested that a reversal was on the cards.
The Awesome Oscillator highlighted the shift in momentum towards the selling side as the bars switched to red. Since the trading volumes also shrunk by nearly 40%, it was difficult to back a bullish outcome for NEM.
Dash [DASH]
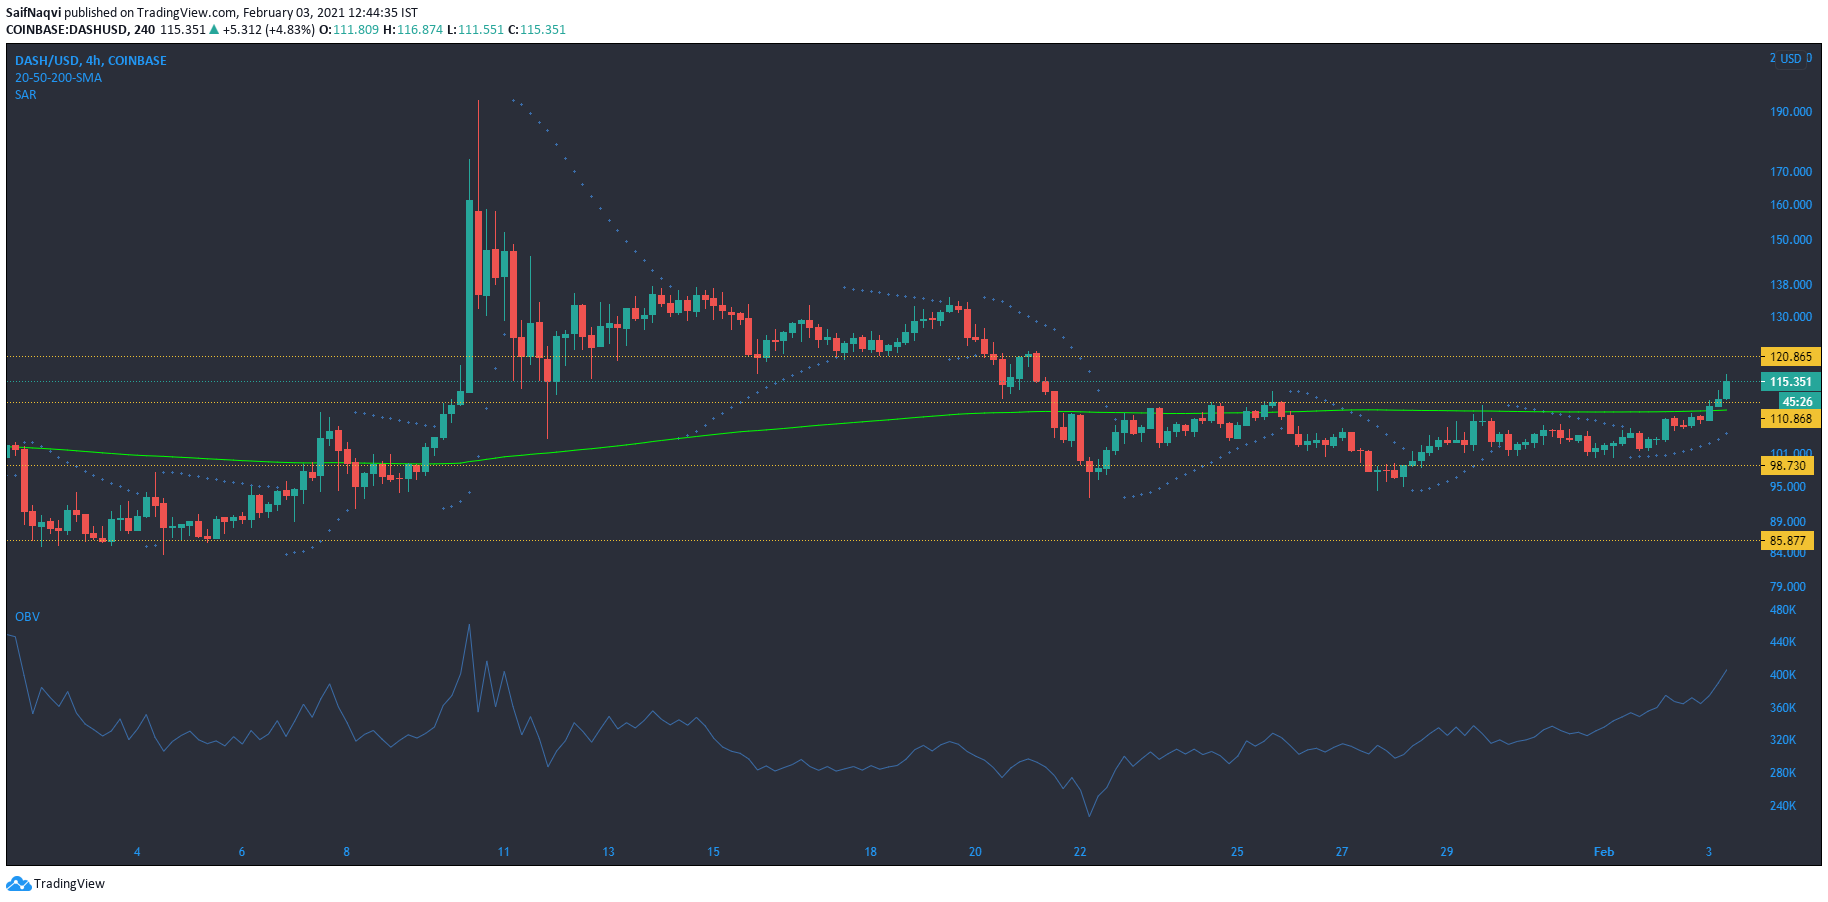
Dash traded in the green zone, at the time of writing, as the cryptocurrency flipped the resistance at $110.8. The candlesticks rose above the 200-SMA (green), signaling the onset of a potential bull cycle, with the on-chain metrics suggesting more bullishness over the coming sessions.
The On Balance Volume showed that a sharp rise in buying pressure helped DASH scale the $110.8-resistance. Finally, the Parabolic SAR’s dotted markers were below the candlesticks, something that underlined the uptrend for the crypto-asset. What remains to be seen is whether DASH can sustain a move above its press time support level in the event of a broader market pullback.


