
Another day, another attack from the market’s bears.
The prices of most cryptocurrencies dropped after Bitcoin rejected the resistance at $35,000. The price dropped by over 6% and went as low as $32,799. Needless to say, the altcoins were quick to follow suit.
Bitcoin Cash [BCH], for instance, along with Polkadot [DOT] and Ethereum Classic [ETC], also dropped lower on the price scale, making the spot market more volatile.
Bitcoin Cash [BCH]
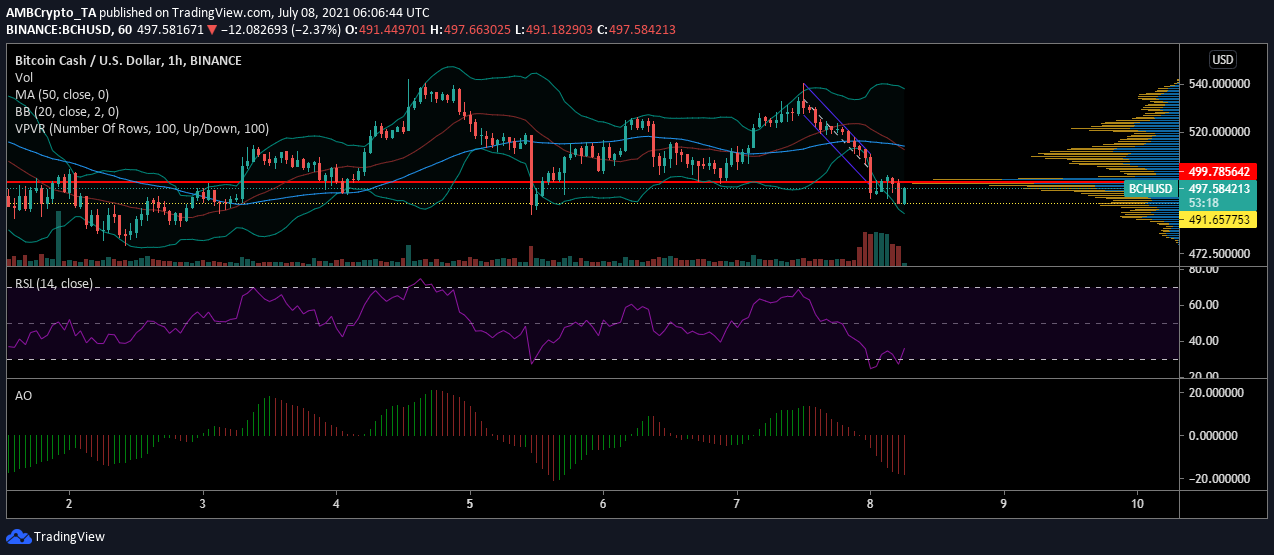
Source: BCHUSD on TradingView
Bitcoin Cash’s price mirrored Bitcoin’s trajectory in the market over the past few hours. Its price fell within a descending channel and finally found support at $491.65.
According to the Visible range, on its way down, BCH was highly traded at $499. This could be the level traders are comfortable with when it comes to the asset. This could also suggest that the low price could remain between $491 and $499 in the short term. Meanwhile, to maintain this level, buying pressure may have to rise and as per the Relative Strength Index, BCH was returning from the oversold zone on the charts.
Nevertheless, momentum has remained negative due to the high volatility in the market.
Polkadot [DOT]
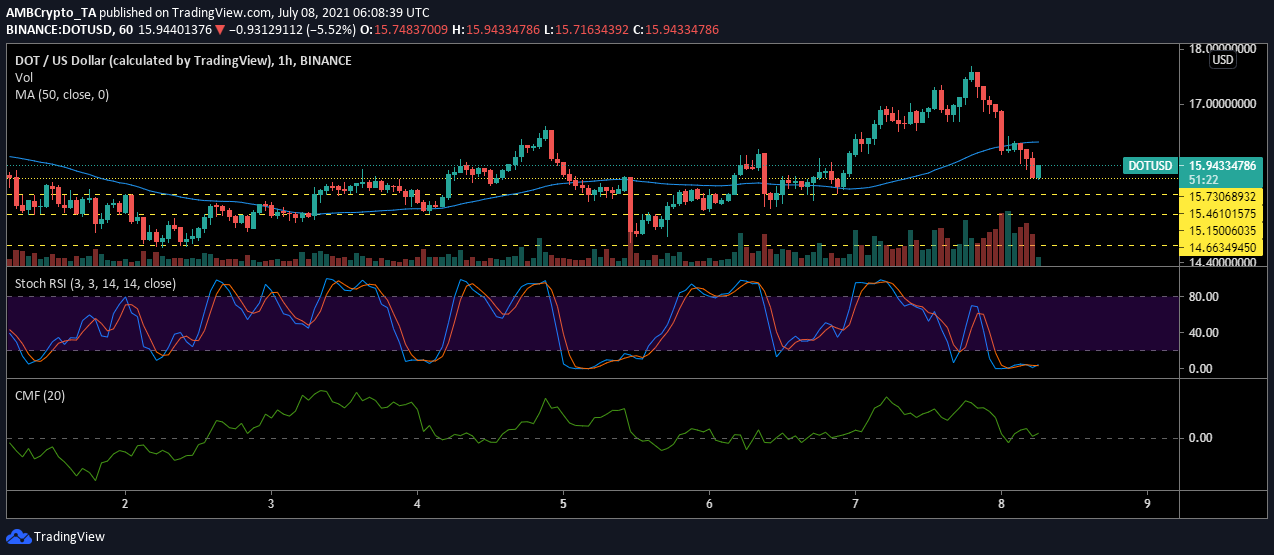
Source: DOTUSD on TradingView
Polkadot’s price was climbing higher and hit $17.67, before it tumbled down to $15.73. As the asset tried to stabilize at this price level, the 50 moving average crossed above the candlesticks, underlining the high downward pressure. This was highlighted by the Stochastic RSI which remained in the oversold zone as the buying and selling pressures fought it out.
The southbound pressure in the market also pushed the Chaikin Money Flow to zero. This meant that the money that was flowing into the market was flowing out. This was a bearish sign for DOT’s price.
Ethereum Classic [ETC]

Source: ETCUSD on TradingView
Ethereum Classic’s market saw a swing in the market trend as the price collapsed. The market turned extremely volatile and the price had not yet found a stable footing at press time.
ETC’s price dropped under the support level at $50.96 after its plunge from $55. This $5 shift in price pushed the bears deep into the market and as highlighted by the Directional Movement Index, ETC’s market was dominated by selling pressure. The -DI surged high above the +DI and maintained its distance. This could mean more losses for ETC’s price.
The MACD indicator affirmed the bearishness as the MACD line crossed under the signal line.