Bitcoin Cash, Polkadot, FTX Token Price Analysis: 05 January

A few of the market’s altcoins like Polkadot and FTX Token rose to record levels over the last few trading sessions, while Bitcoin Cash was registering a correction, one that saw the price move towards the $415-mark.
Bitcoin Cash [BCH]
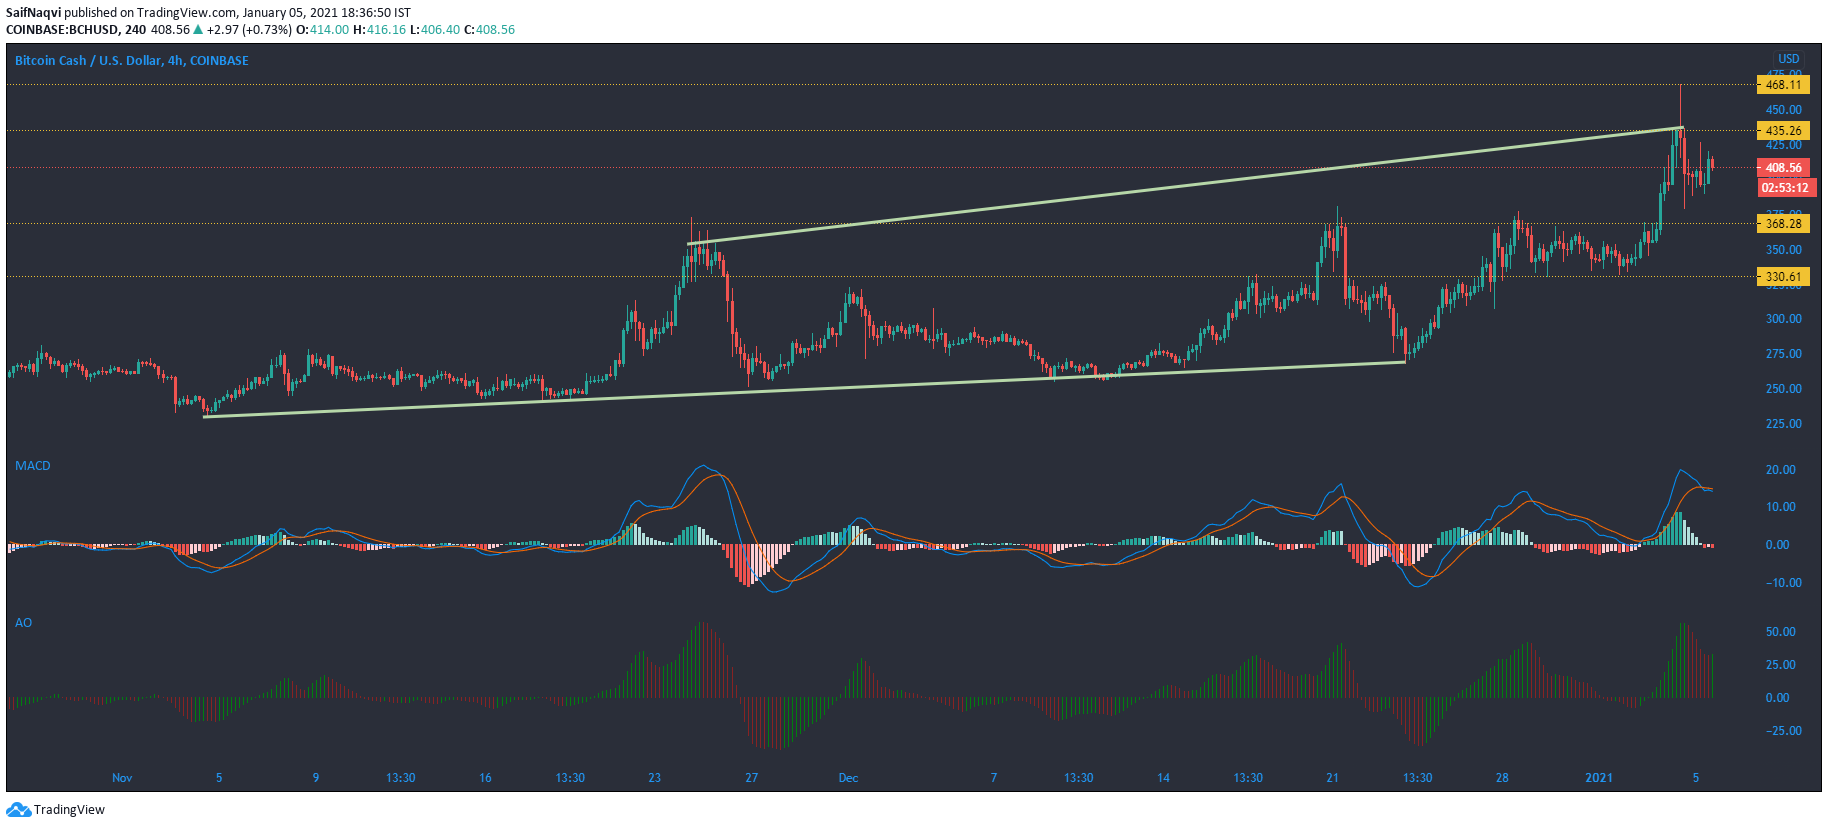
A look at Bitcoin Cash’s 4-hour chart showed that the cryptocurrency was noting a minor correction after the price climbed as high as $467.76, a level not seen since February 2020. While BCH has been in the green over the past 24 hours, certain indicators signaled that the correction could extend over the next few trading sessions as well.
The MACD noted a bearish crossover while the histogram also registered bearish movement.
Finally, the Awesome Oscillator’s red bars were moving towards zero, a sign that the price was indeed bearish. The support at $368.28 could offer some relief to prices if they move lower on the charts.
Polkadot [DOT]
Polkadot’s price skyrocketed at the beginning of 2021. In fact, in the last seven days, DOT rose by over 46%, adding a monstrous $3.63 billion to its value, taking the total market cap to $8.29 billion. Clearly, Bitcoin’s bull run has been quite favorable for DOT’s movement. The surge over the past couple of weeks has also been bolstered by Binance’s decision to fund projects worth $10 million on Polkadot’s network.
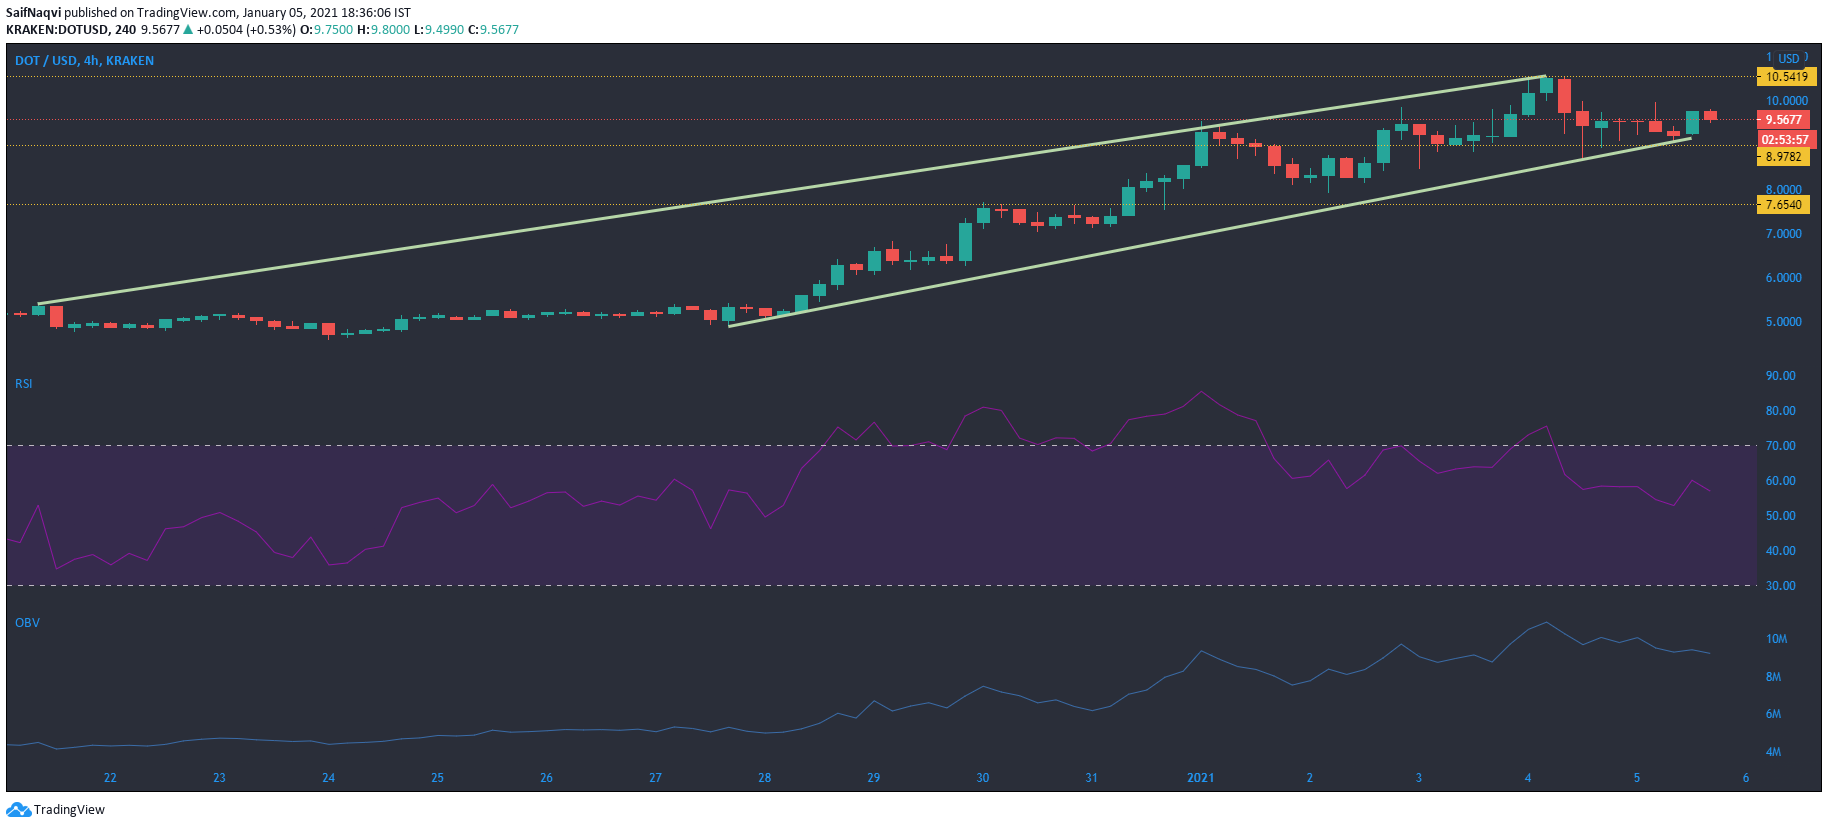
However, after snapping an all-time high of $10.5 just yesterday, the price cooled down and traded close to its support at $8.97. The short-term outlook could see the price continue to consolidate between its present channel.
The Relative Strength Index was moving towards the neutral zone after trading in the overbought area. This suggested that the price was losing steam and the bullish momentum was slowing down.
Although the On Balance Volume was in the higher territory, it was pointing south, a sign that it could move lower and drag prices along with it.
FTX Token [FTT]
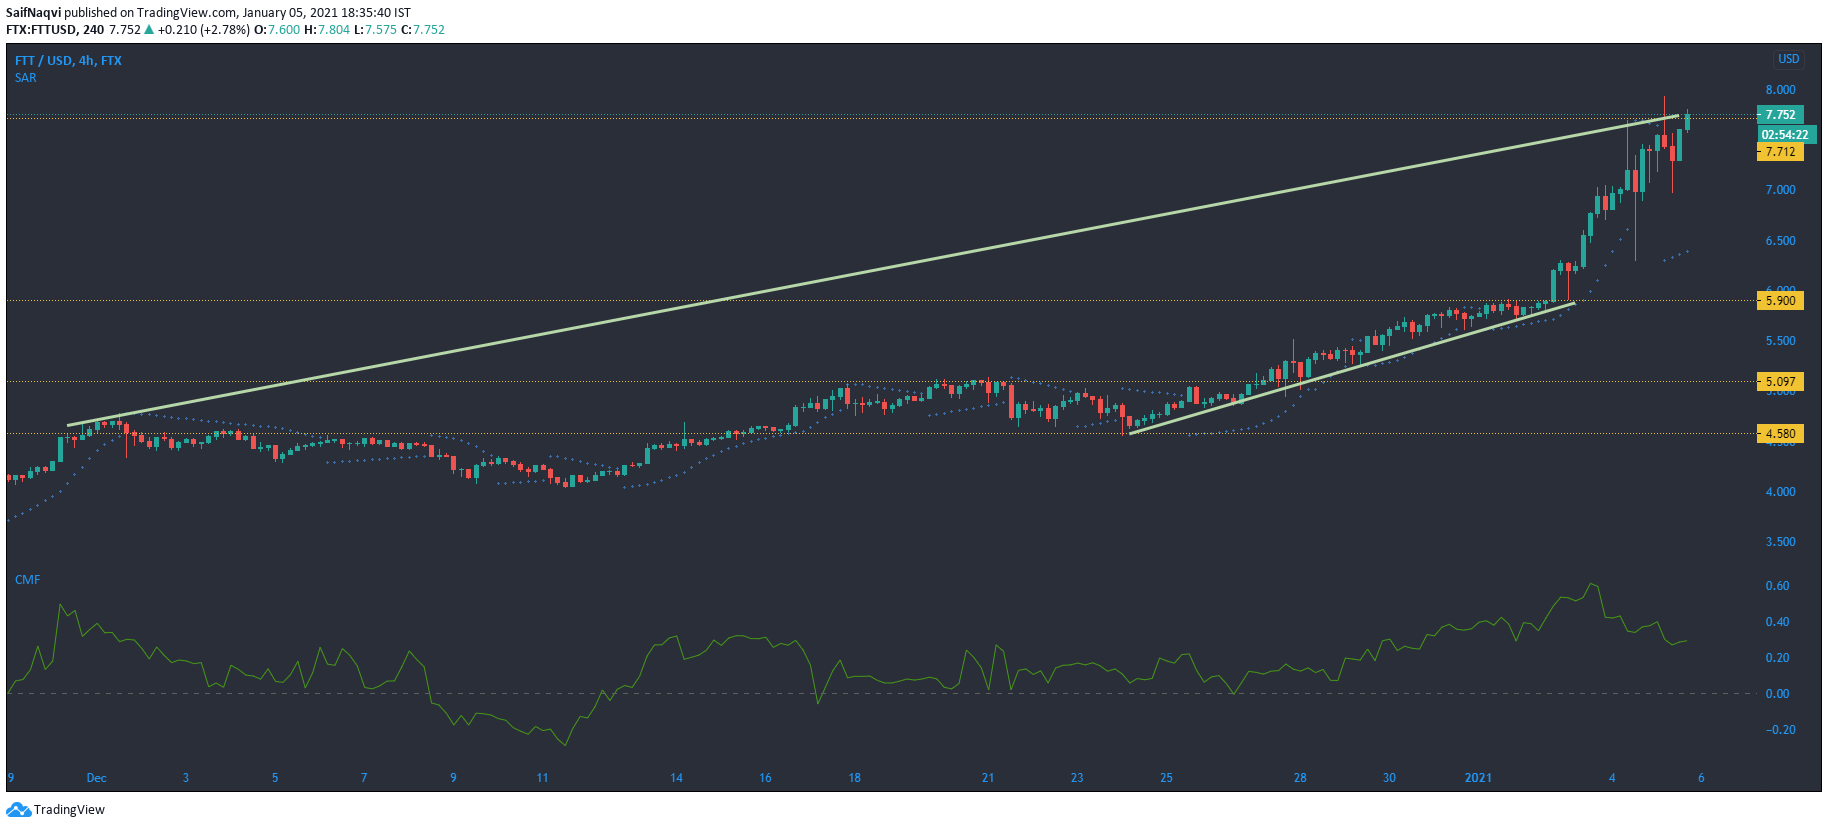
Much like its competitor Polkadot, FTX Token has also had a good start to January as the price rose by over 38% over the past week. The rally pushed FTT to record levels, with the cryptocurrency trading at an all-time high of $7.9, at the time of writing. However, a correction could be just around the corner, depending on BTC’s and ETH’s movement going forward.
The Chaikin Money Flow showed that capital inflows moved in tandem with the price hike. During the last couple of days, money was flowing away from the cryptocurrency, which hinted at a possible pullback in prices. If prices do fall, support can be offered at $5.90.
The Parabolic SAR’s dotted markers were under the candlesticks, indicating that the price was indeed bullish.


