
At the start of this month, Bitcoin Cash was trading at $420. Since then, it has made rapid gains but Bitcoin Cash hit a ceiling at $770 and has not been able to revisit those highs over the past few days. The $740 level has acted as a stubborn resistance as well in the short-term. BCH threatened to slip beneath a range it had formed, and such a slip could drive prices as far south at $580.
Bitcoin Cash 30-minute chart
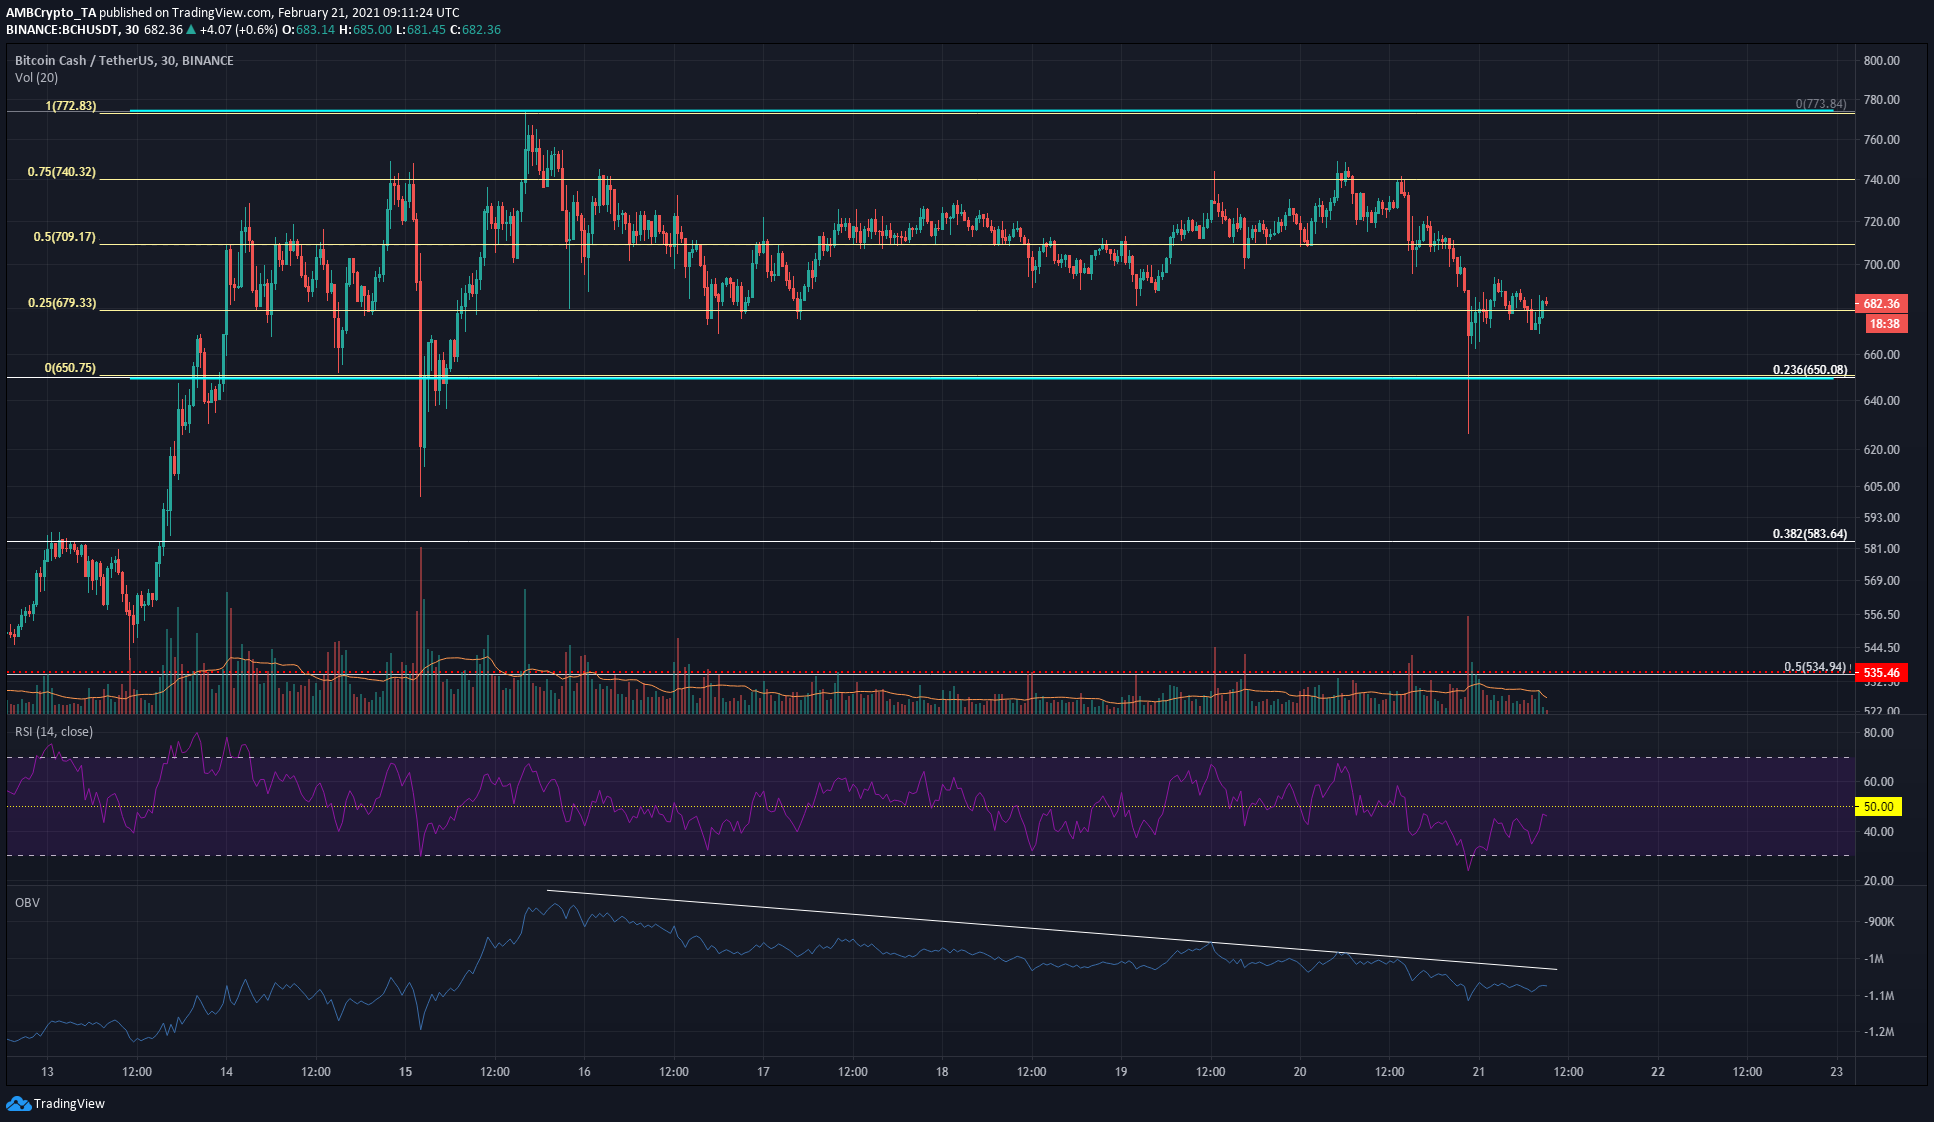
Source: BCH/USDT on TradingView
On the charts, a range between $650 and $770 has been plotted. The yellow levels represent levels of importance within the range that the price could find support at, with particular emphasis on the mid-point of the range at $709. The mid-point of the range is the most crucial level within a range, and ceding it to the bears does not bode well for BCH in the short-term.
Market Rationale
Over the past few days, the OBV has been sliding downward alongside BCH’s losses. This indicated that genuine selling pressure was behind the coin’s recent losses. In the long-term, this was just a blip on the large upward spikes the OBV has posted- but in the short-term, the OBV downtrend is significant.
The RSI also slipped beneath neutral 50 has continued to stay beneath it to show bearish pressure.
Trading volume has been steady, but the loss of the $709 level was followed by a wave of intense selling. This showed market conviction sided with the bears.
Levels to watch out for
The $709, $679, and $650 are the most significant levels to watch over the next few days. Losing $679 will likely see BCH pushed down to $650, where the market will once more see a fierce skirmish between buyers and sellers.
The defense of the $679 level will give bulls some impetus to attempt to scale $709 once more.
Conclusion
Over the next few days, it would be best to gauge market sentiment at certain levels before deciding upon entering the market. A visit to $650 would represent an opportunity to either buy or take a short position, based on the reaction of the price at that mark. Reclaiming the $709 level as support after bouncing off $679 would also be a buying opportunity.