Bitcoin Cash, Synthetix, DigiByte Price Analysis: 27 December

At the time of writing, Bitcoin had surged past $27,000 and it was on its way to breach yet another price level – $28,000. On the back of Bitcoin’s exponential movement, its fork, Bitcoin Cash, rose on the charts too. Bitcoin Cash flipped the $326-level from resistance to support. Further down the charts, DigiByte went parabolic over the past few hours while Synthetix also broke past significant levels of resistance recently.
Bitcoin Cash [BCH]
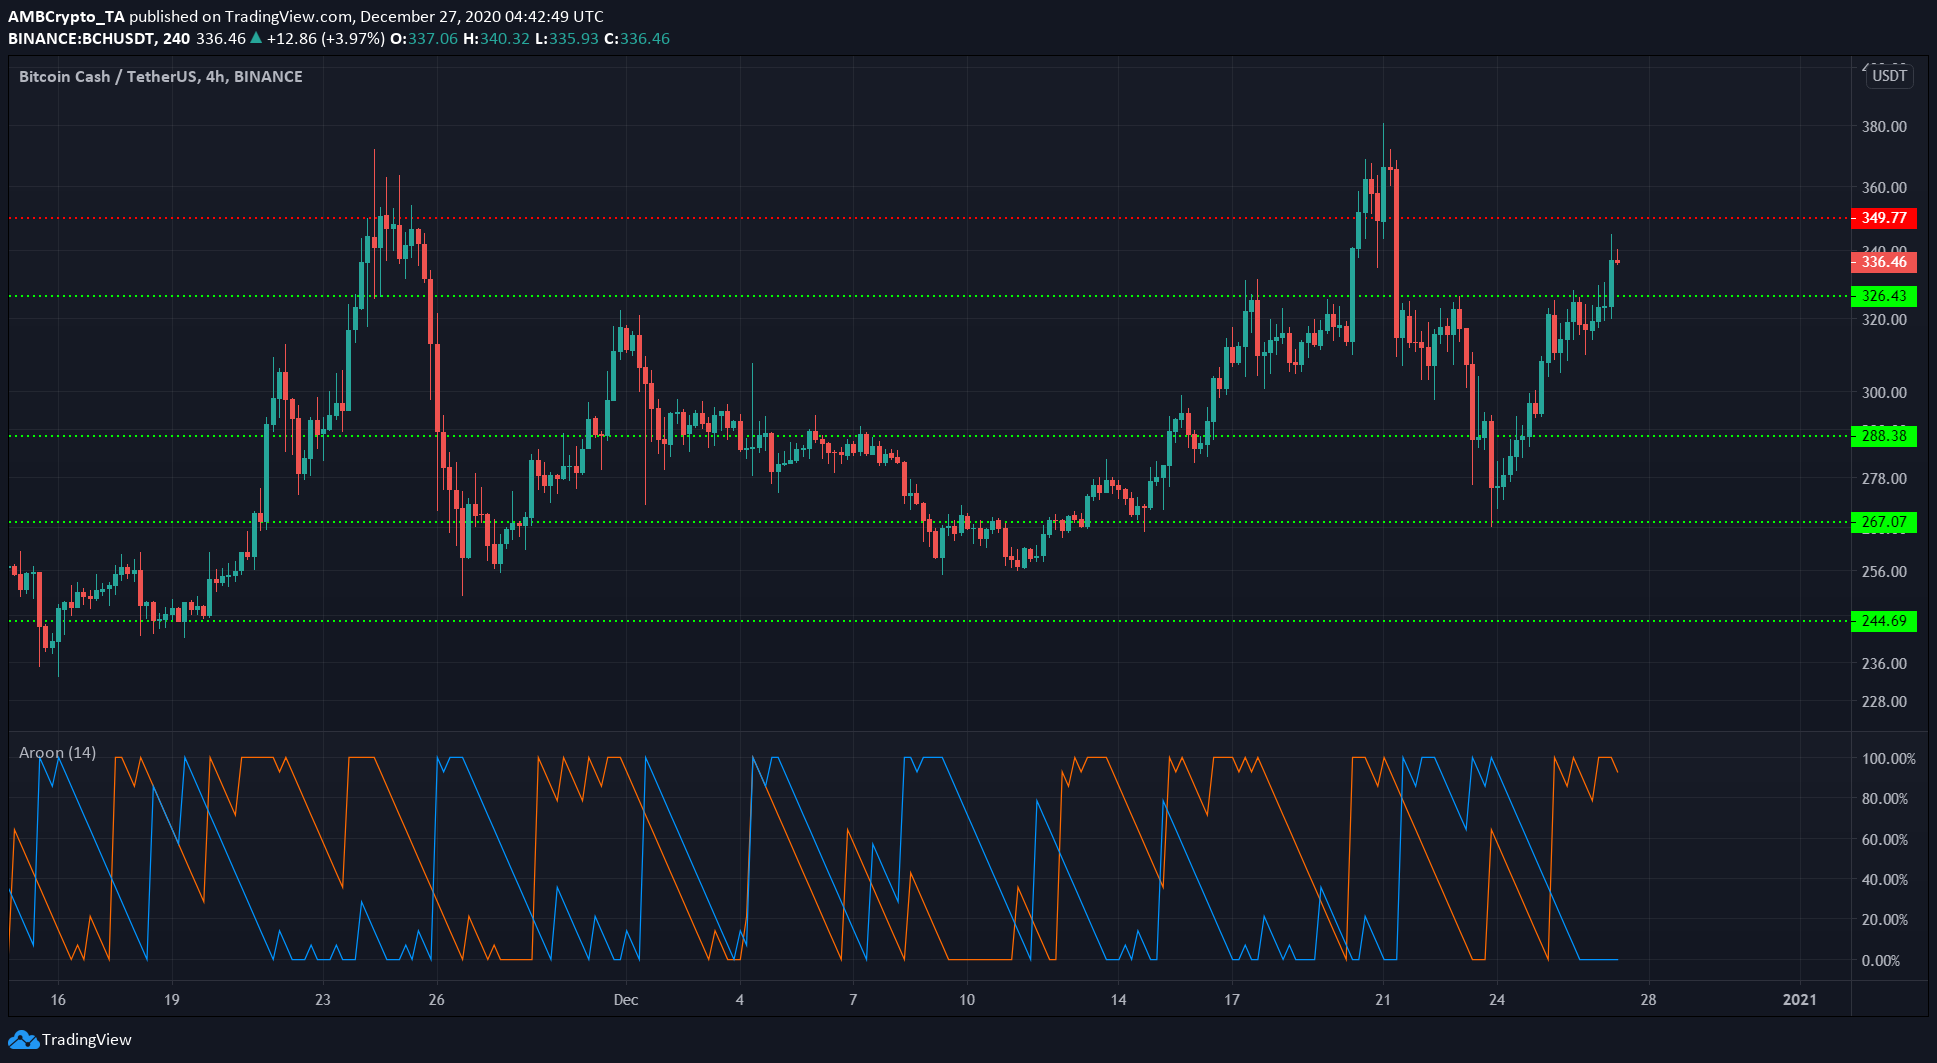
Bitcoin Cash rose past $300 and later, the pocket of liquidity in the vicinity of $320, and it was trading at $336, at press time.
The Aroon Indicator indicated that BCH has been strongly trending upwards since Christmas. The next level of resistance was at the $350-mark and BCH appeared likely to breach that level as well.
The next region of resistance lay at $385-$400 for BCH.
Synthetix [SNX]
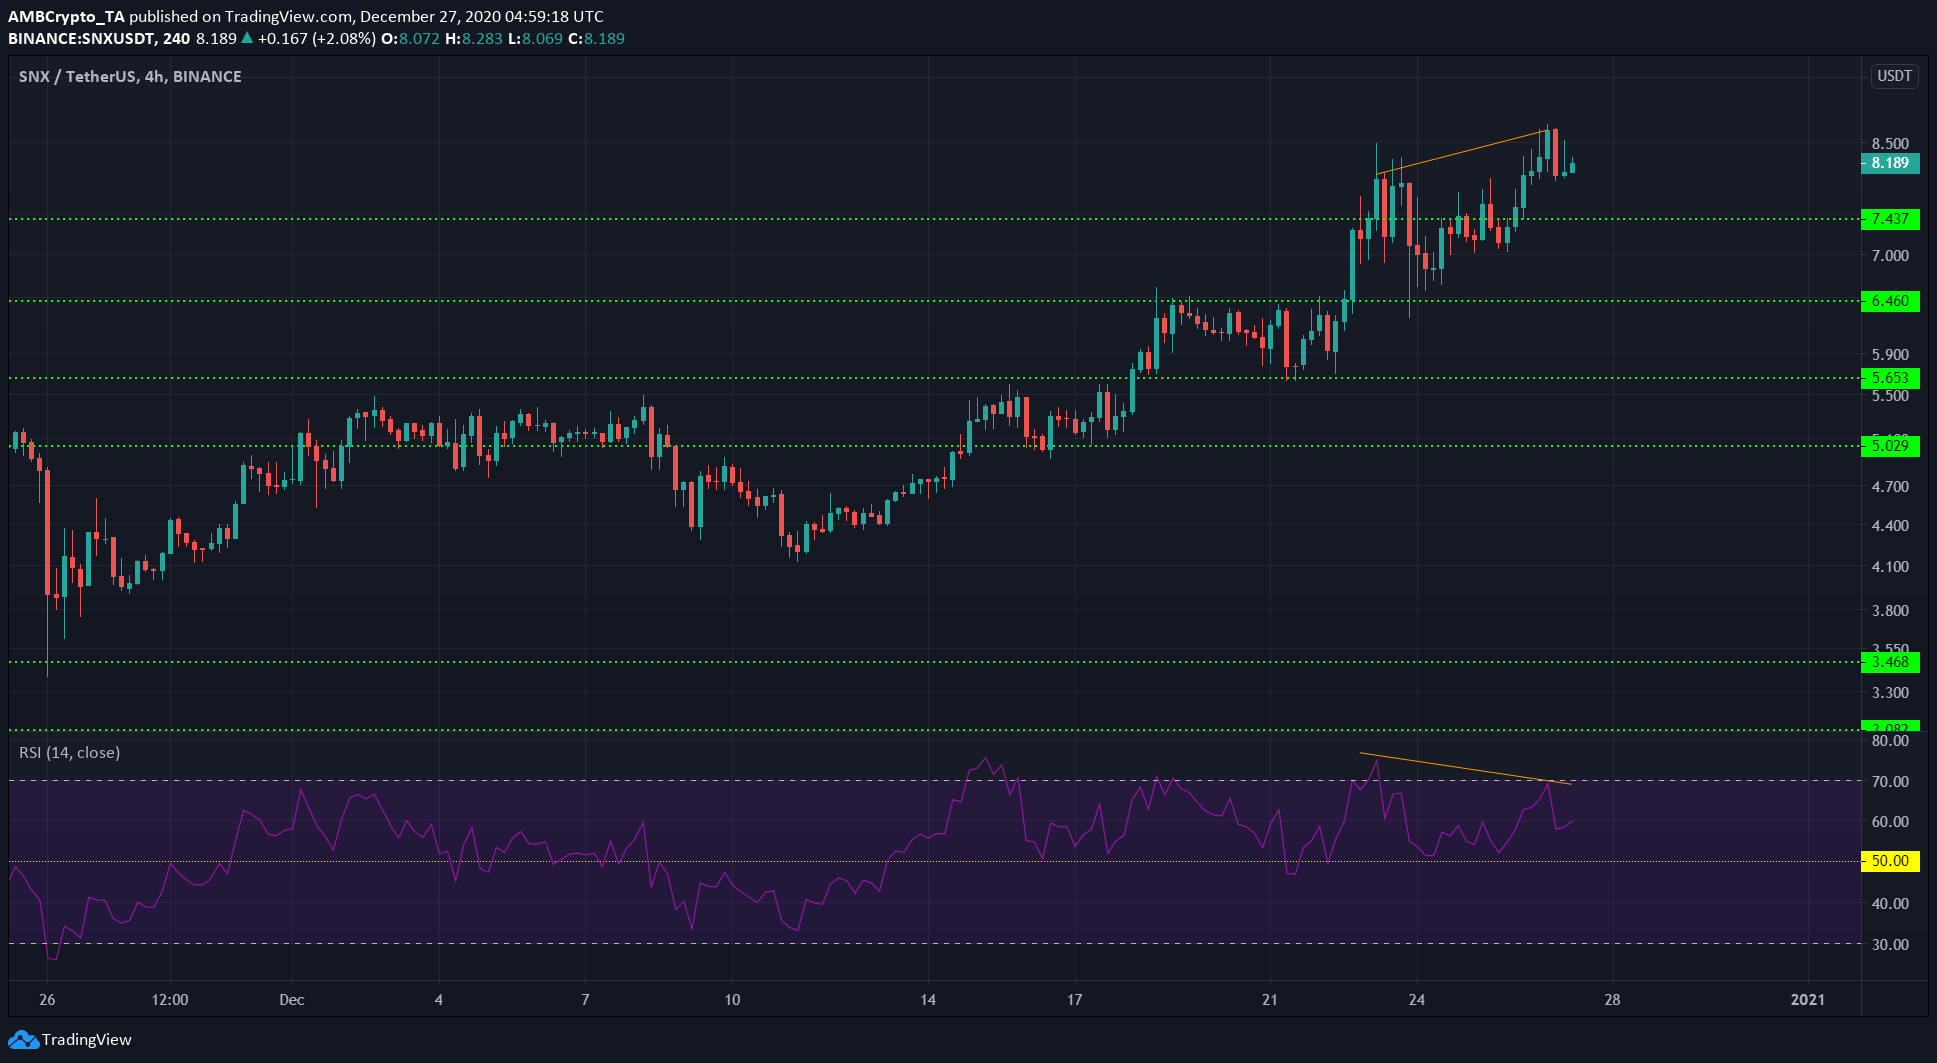
Synthetix rose past the $8-level on the price charts. It had last visited $7.7 in late-August, but it has faced heavy losses since. SNX rose as high as $8.6, but it was forced to correct and retest the $8-support after it exhibited a bearish divergence between the price and the momentum.
The RSI still registered a value of 60, something that indicated strong bullish momentum. While the price saw some consolidation in early-December around $5, before it dropped to $4, it has since been strongly trending upwards.
This can be expected to continue over the coming days, with the psychological $10-level likely to pose as a strong resistance.
DigiByte [DGB]
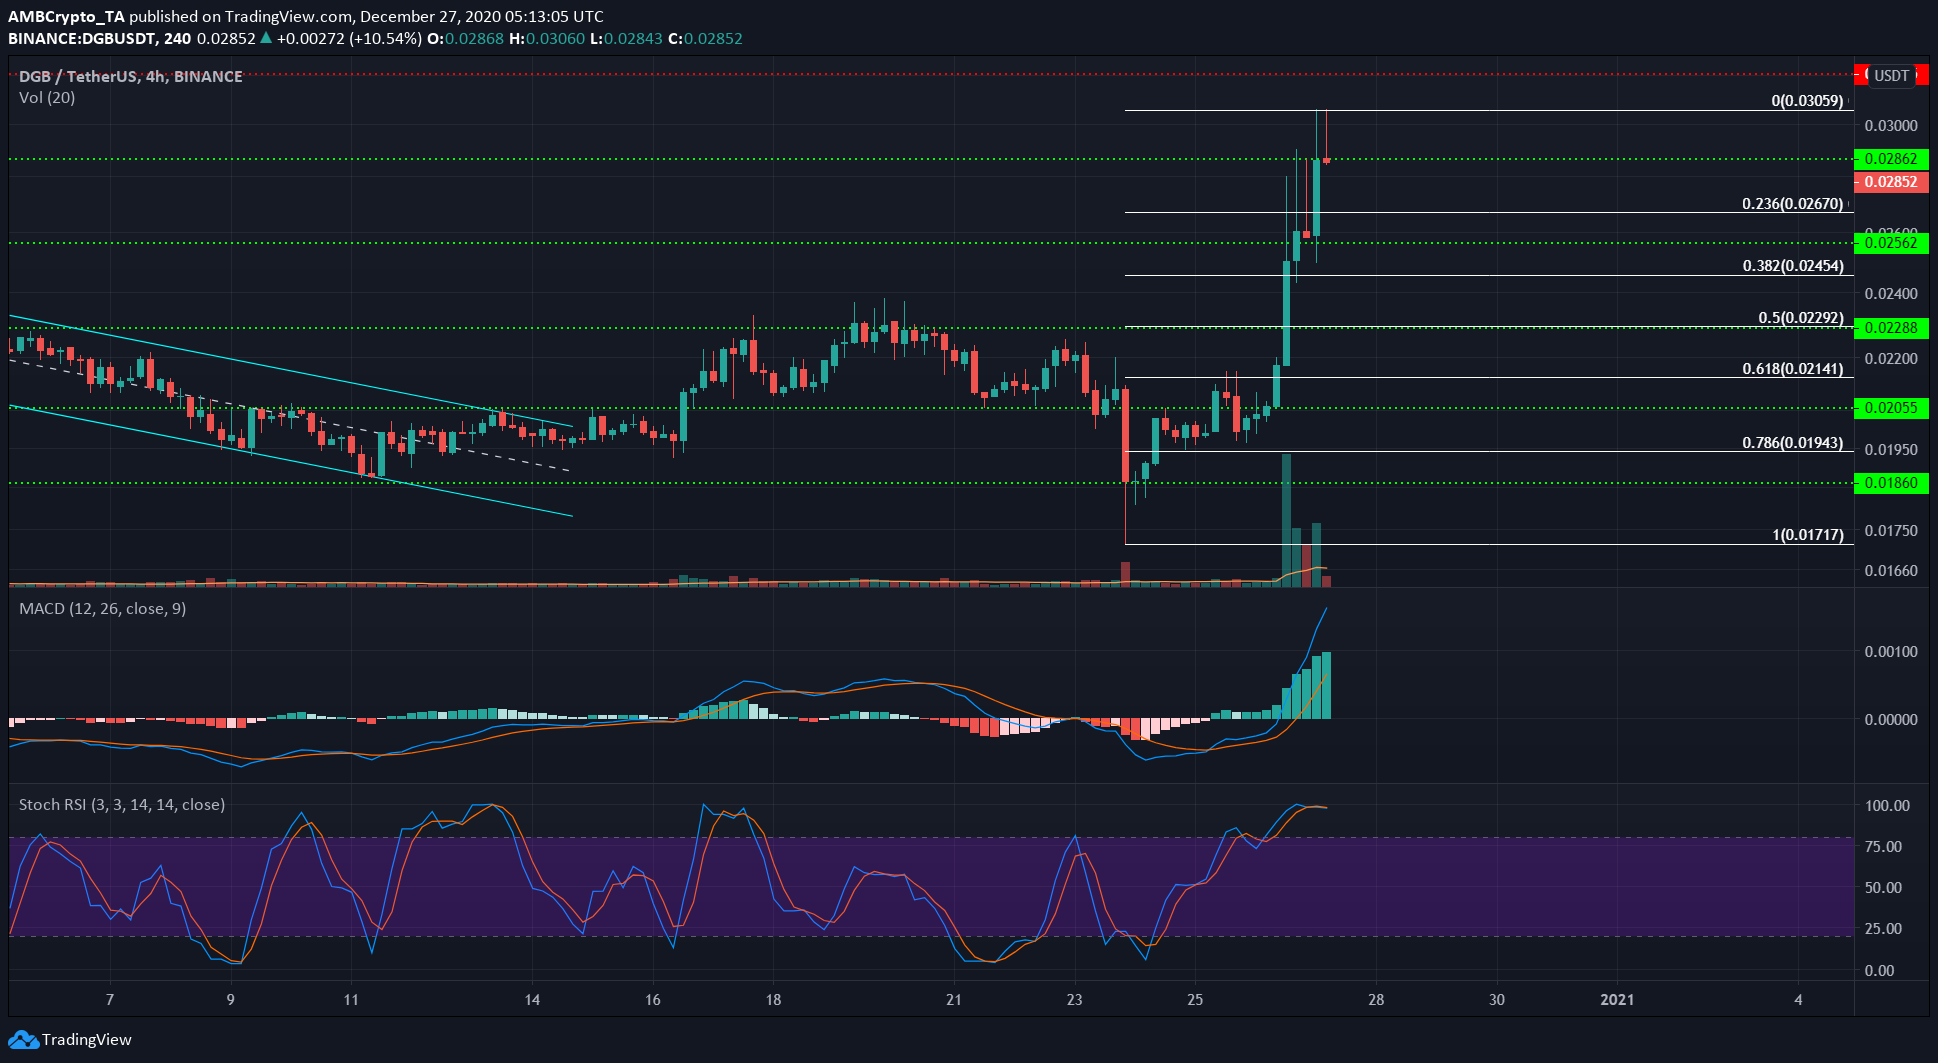
DGB registered gains of nearly 40% in 24 hours as it shot upwards after testing the $0.018-level as support and sailing past the $0.02-level the previous day.
Both the MACD and the Stochastic RSI pointed towards an overbought market, but catching the exact top would be tricky. The Fibonacci Retracement tool showed that the 50% retracement level lined up with the horizontal support at $0.022.
If the price fails to rise above the swing high used to highlight retracement levels, a move to $0.022 could be on the cards.