Bitcoin Cash, Tron, Cosmos Price Analysis: 22 December

The previous day’s Bitcoin drop affected the altcoin market significantly. Bitcoin Cash posted losses of nearly 15%, but bulls had some hope, as long as the price remained above $300. Tron was likely to climb a little higher up the charts to test a level of resistance before another move downward. Cosmos was trading at the $5 level but could descend lower once more.
Bitcoin Cash [BCH]
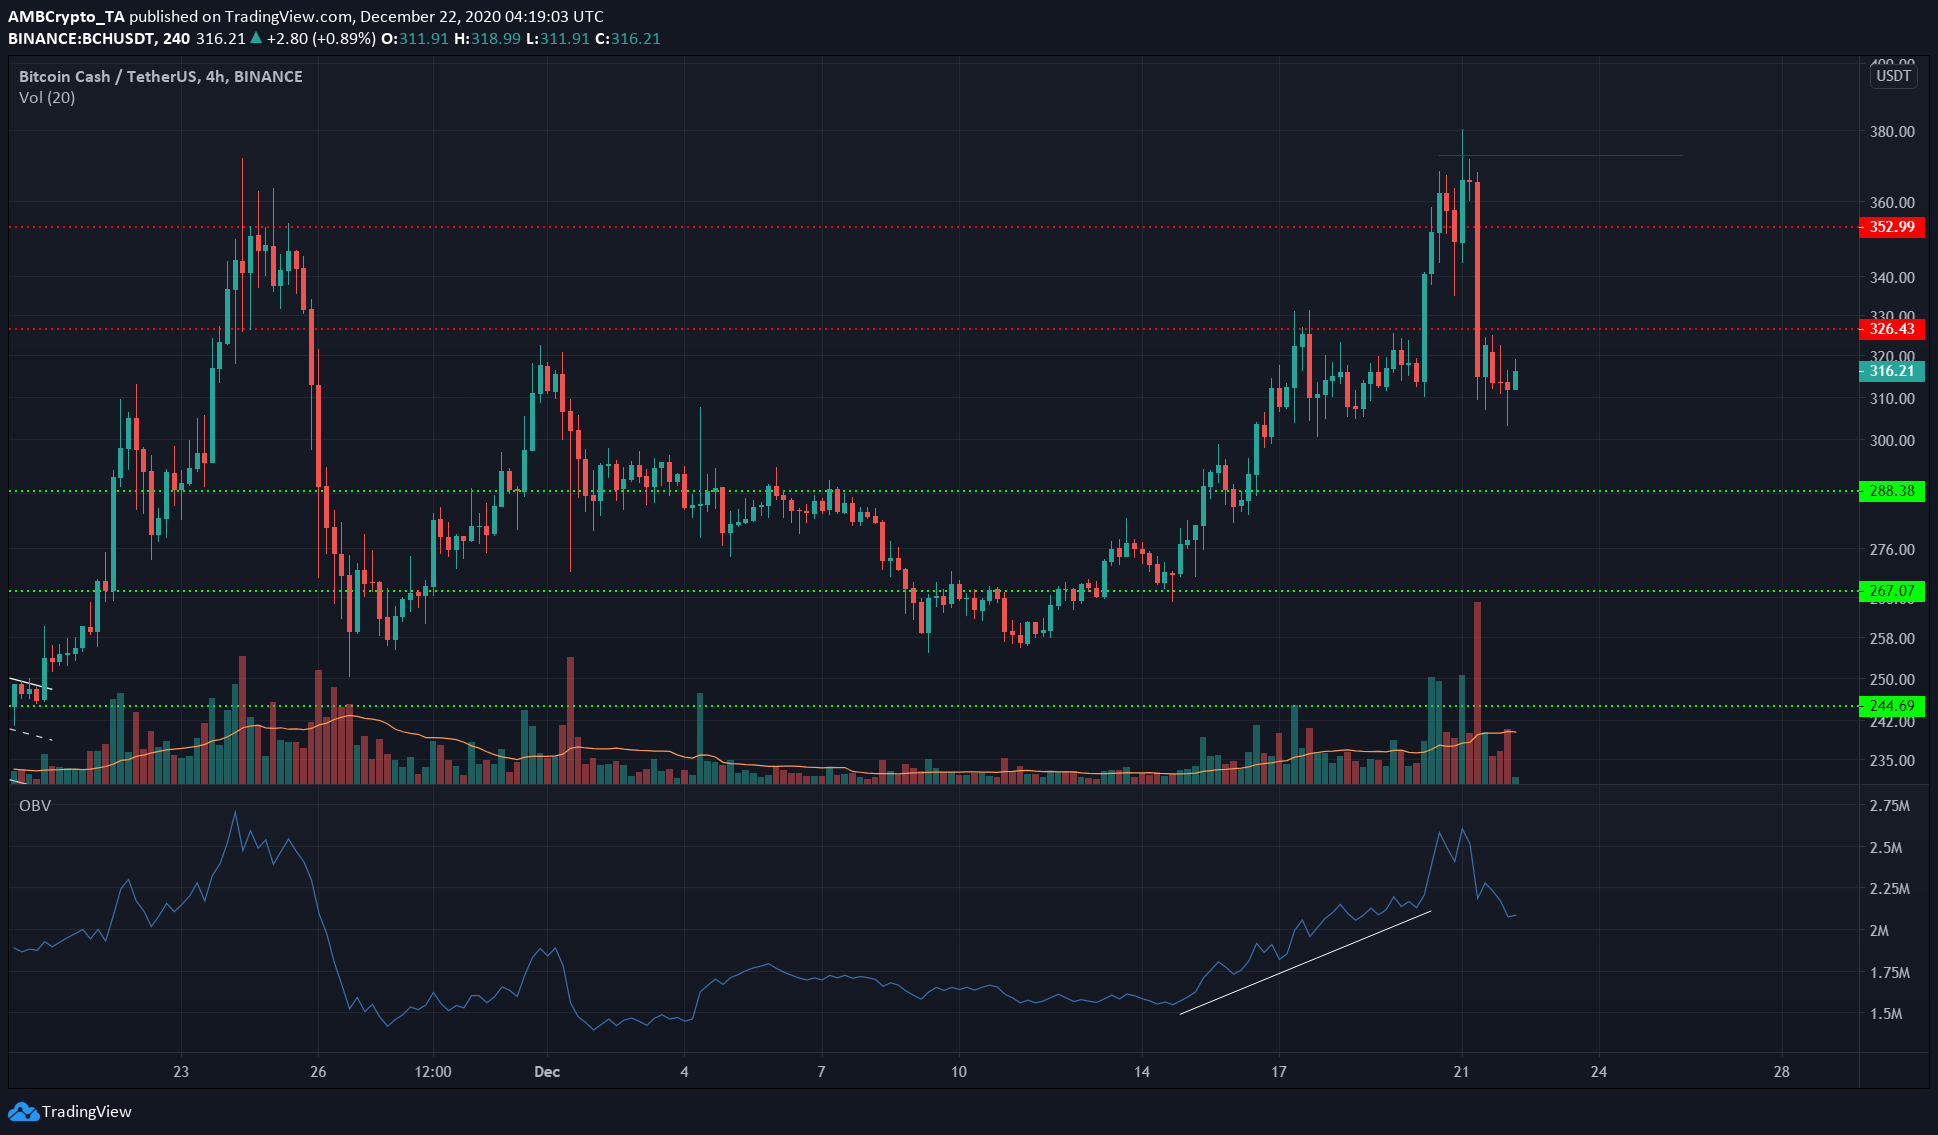
The resistance at $373 was not overcome and a drop of nearly $1,200 for BTC saw BCH suffer on the charts.
Before the recent sharp dip for Bitcoin, which affected Bitcoin Cash drastically, there was steady buying volume that drove prices higher for BCH.
The reaction of the price at the $326 level would be indicative of the next direction for the market. It is expected that, due to the healthy rally of the past two weeks, BCH would consolidate under this resistance level and eventually climb higher.
However, a rejection at $326 would indicate more losses inbound for BCH. A drop below the $300 mark would put bears firmly in the driving seat.
Tron [TRX]
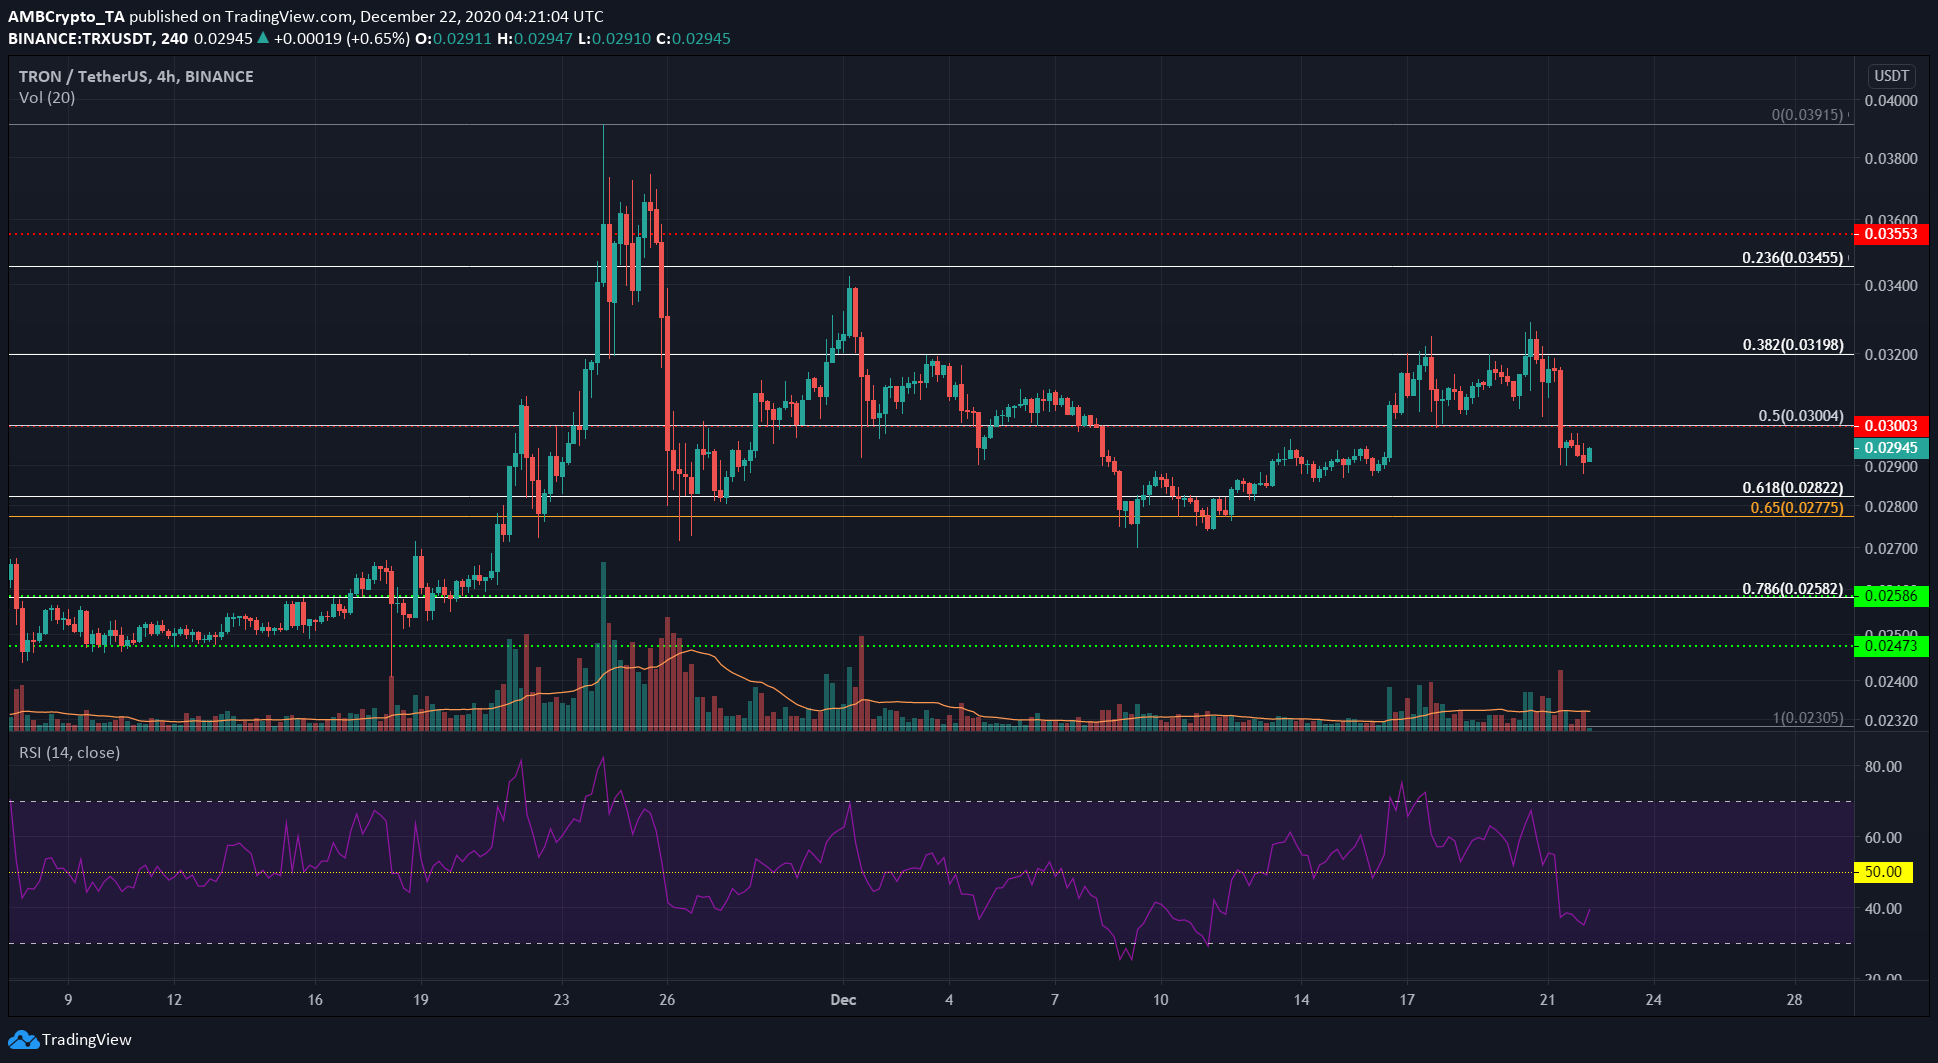
Using the Fibonacci Retracement tool for TRX’s move from $0.023 to $0.039 in November, some critical levels of support were highlighted for TRX.
The golden pocket, the region between the 65% and the 61.8% retracement levels, has served as support for TRX and was likely to do so once more. The RSI showed that the coin had strong bearish short-term momentum.
A retest of the 50% retracement level at the $0.03 price point can be expected before another move toward the golden pocket.
Cosmos [ATOM]
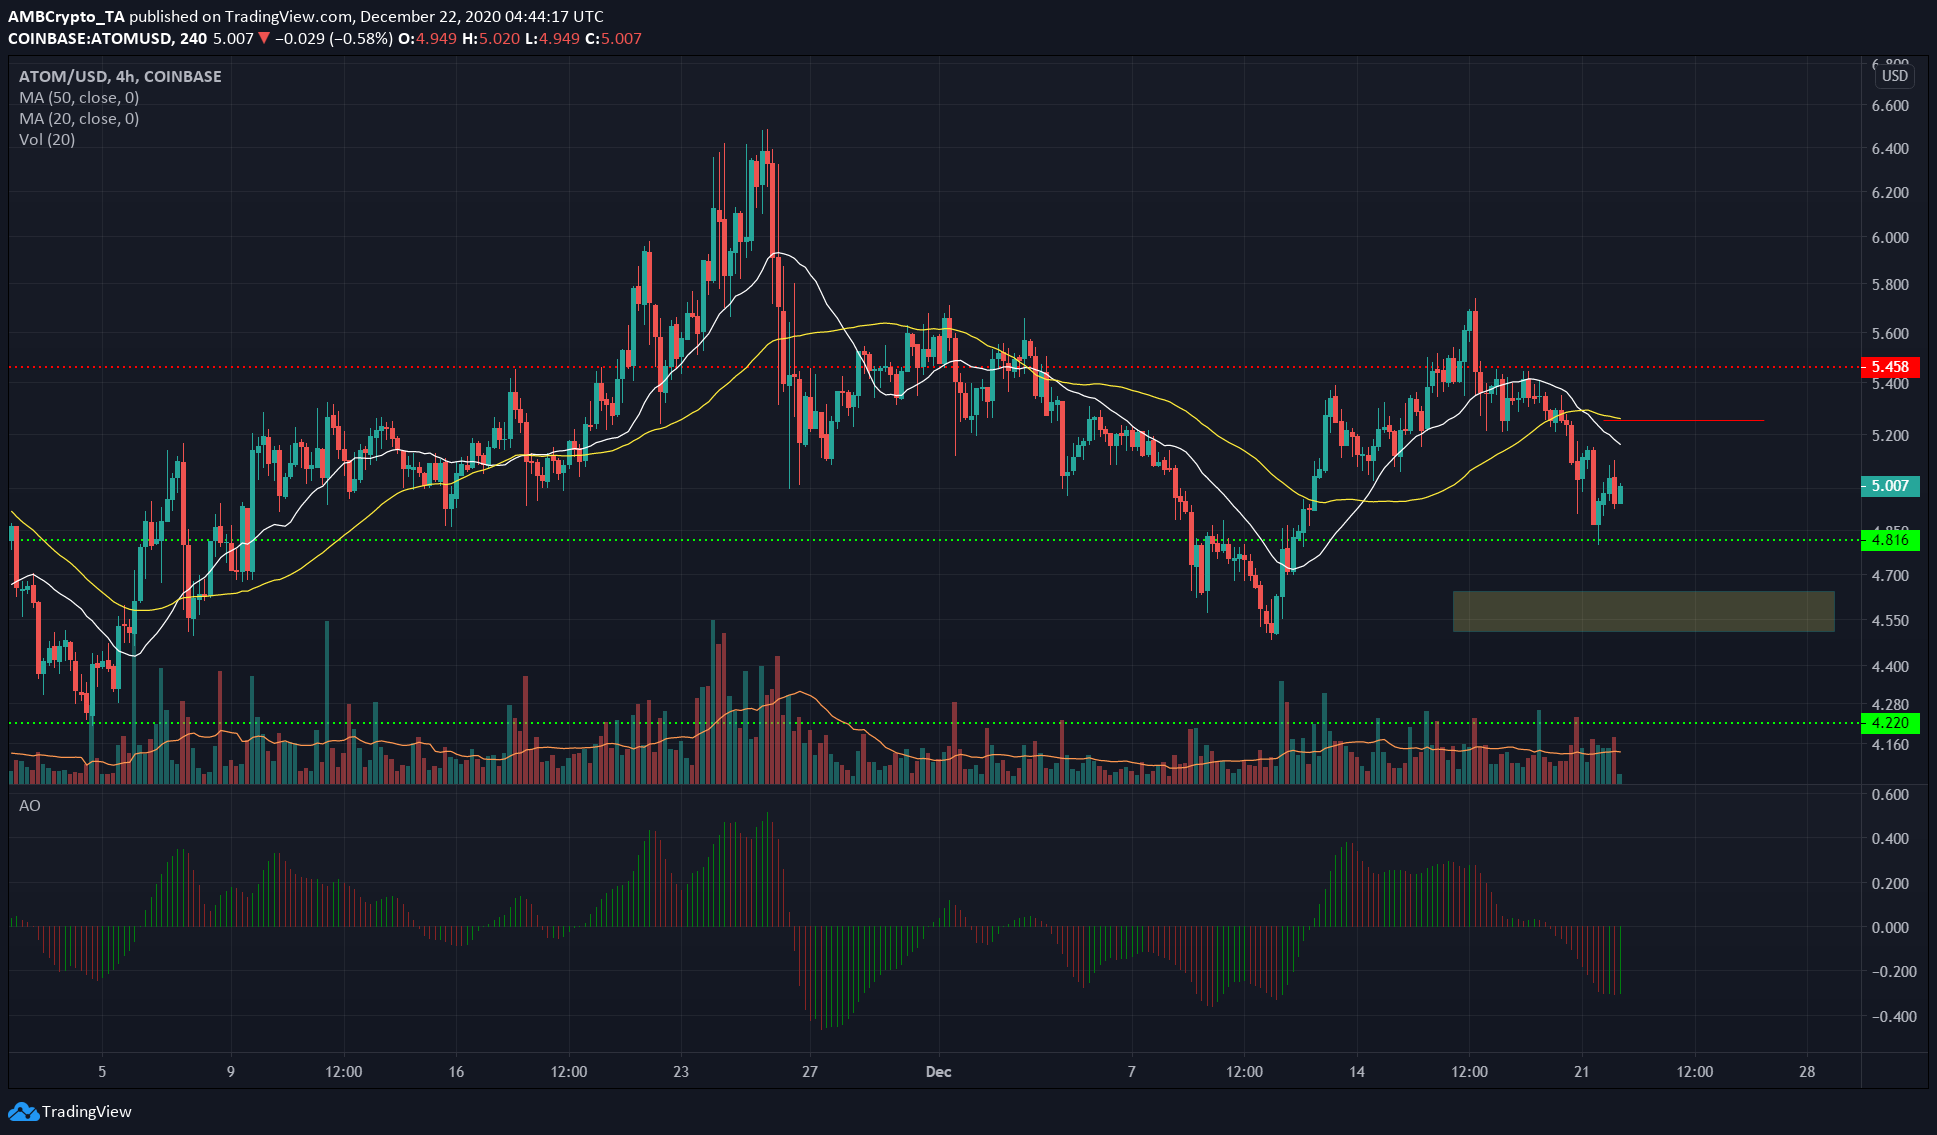
The selling pressure behind ATOM was exacerbated by a falling BTC. The Awesome Oscillator showed no change in the downward momentum.
The 20 SMA (white) crossed beneath the 50 SMA (yellow) to denote short-term bearishness. The 20 SMA can also be expected to act as resistance.
A drop below the $5 level would see ATOM retest the $4.8 level of support. The pocket of liquidity in the vicinity of $4.5 would also act as a region of demand should ATOM reach those levels. For the coin, the $5.25 and $5.45 are levels of resistance.


