Bitcoin Cash, Tron, Fantom Price Analysis: 17 February

To affirm a healthy recovery phase, Bitcoin Cash still needed to close above the 50 EMA near the $331-resistance. On the other hand, Tron displayed a short-term uptrend as it swayed above its 20 EMA. But the 38.2% Fibonacci level continued to pose as a hurdle. Also, Fantom snapped off its trendline resistance and eyed at $2.2-mark while struggling to gather enough volumes.
Bitcoin Cash (BCH)
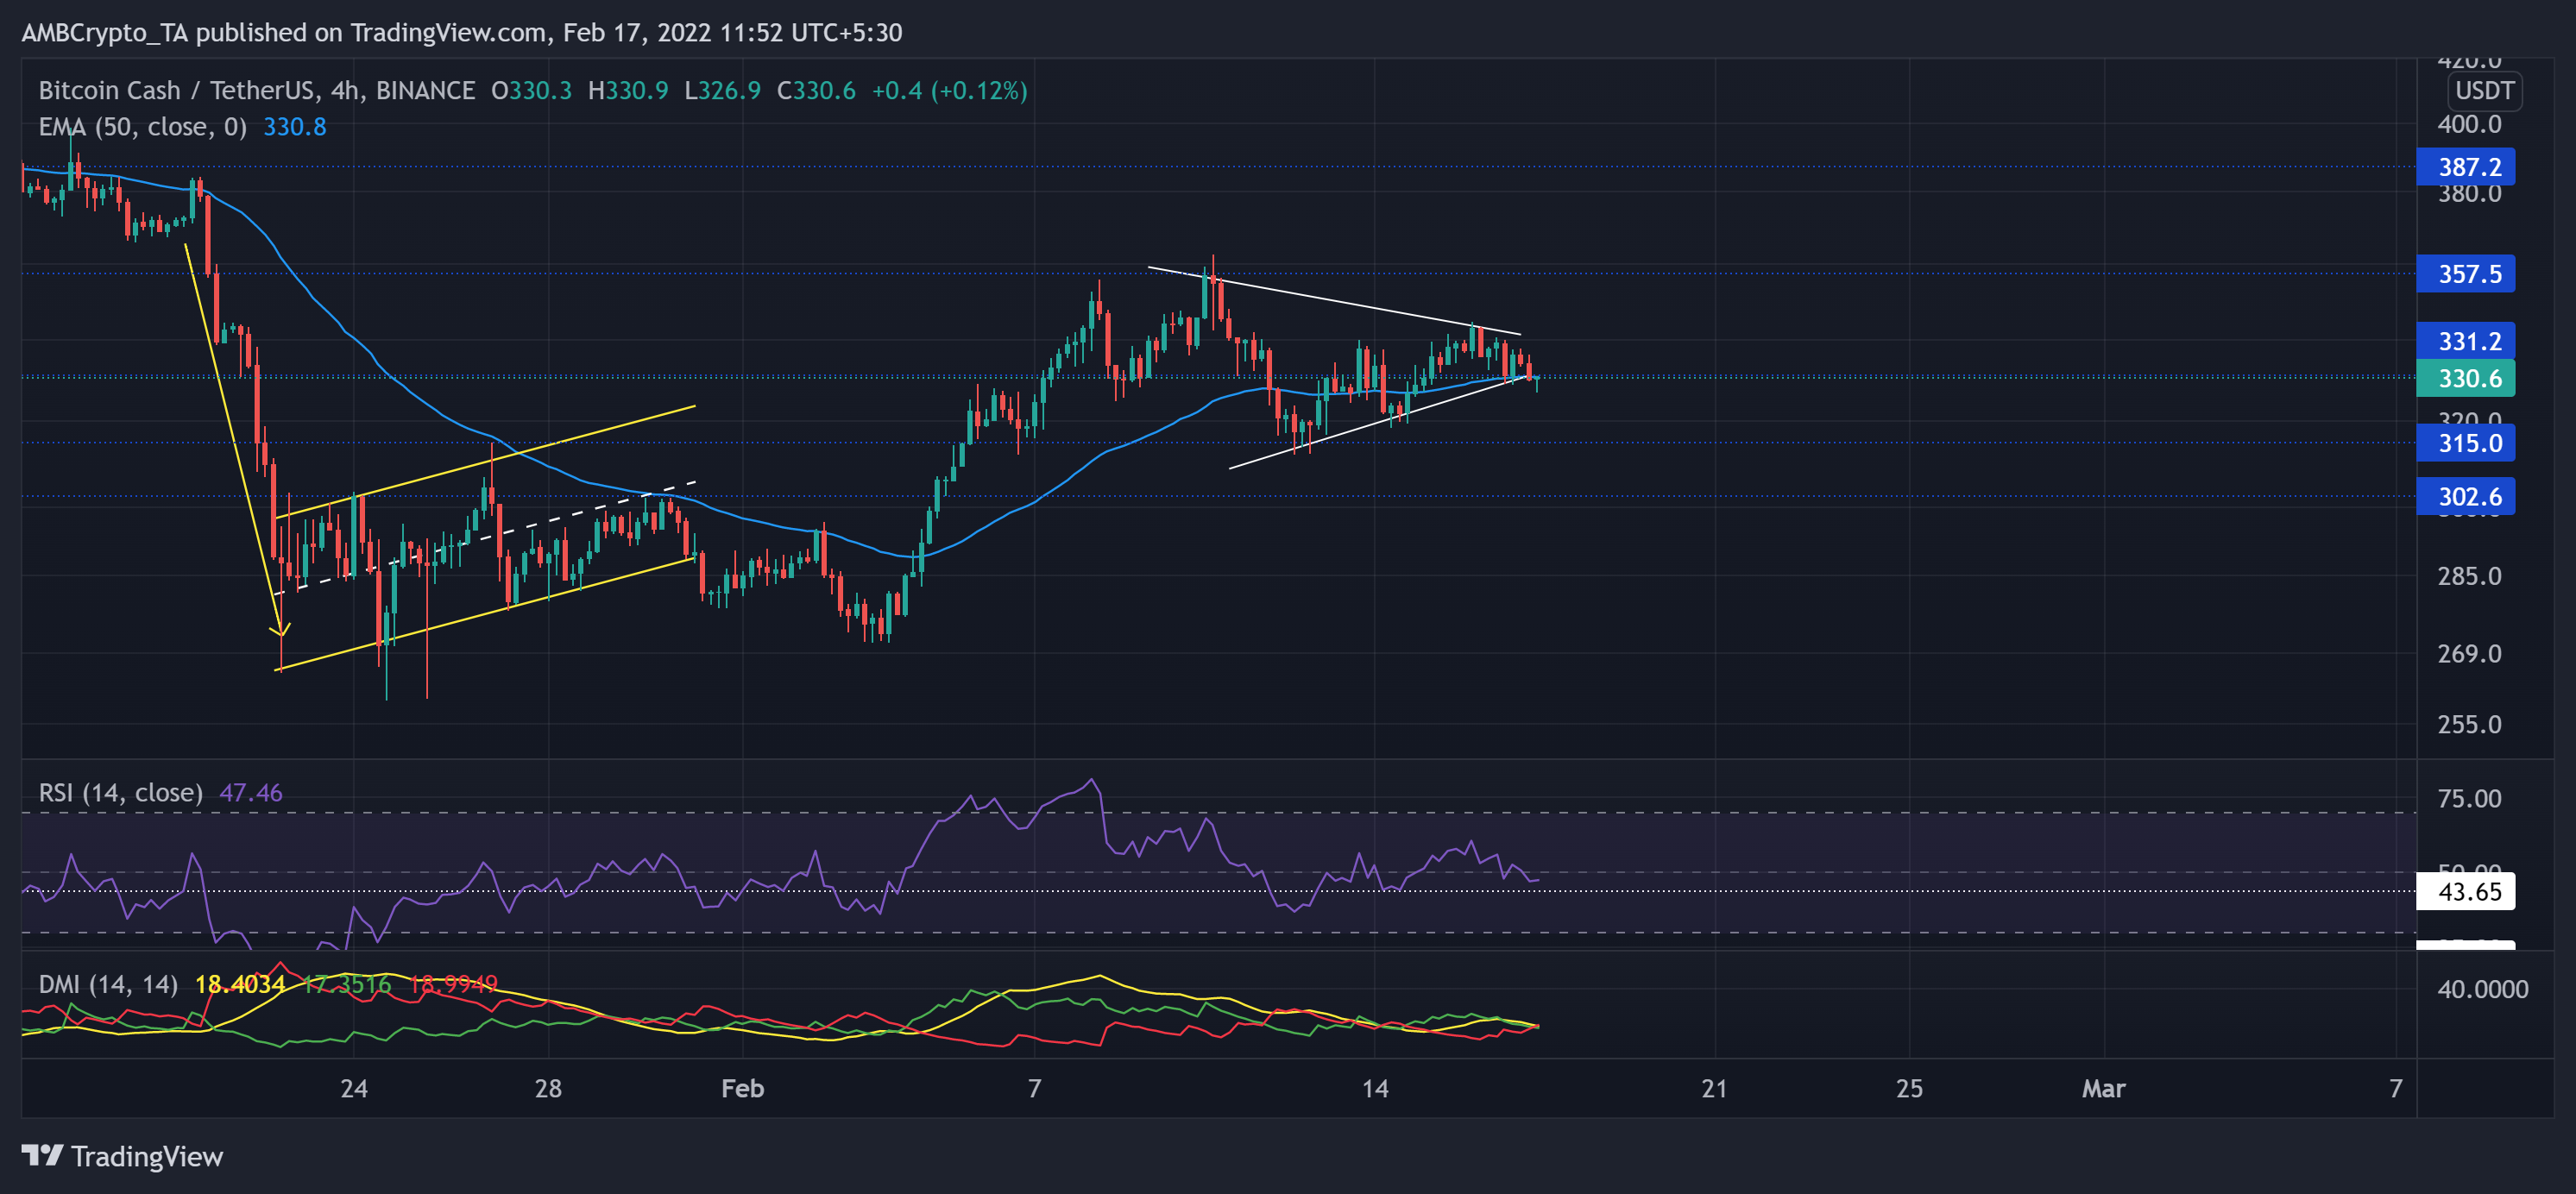
As the bearish phase initiated, BCH steeply declined and lost its one-year support (now resistance) at the $387-mark. After a nearly 38% retracement (from 5 January), it hit its 13-month low on 24 January.
Then, the bearish flag breakdown reversed from the $270-mark long-term support. As a result, it recovered its previous losses and flipped the 50 EMA (blue) from resistance to support. Over the past day, BCH saw a symmetrical triangle break out. Thus, it fell below the $331-resistance that coincided with the 50 EMA.
At press time, BCH traded at $330.6. The RSI downturned and lost the midline support. Any further retracements would find support near the 43-point. Although the DMI lines saw a bearish crossover, the ADX still depicted a weak directional trend.
Tron (TRX)
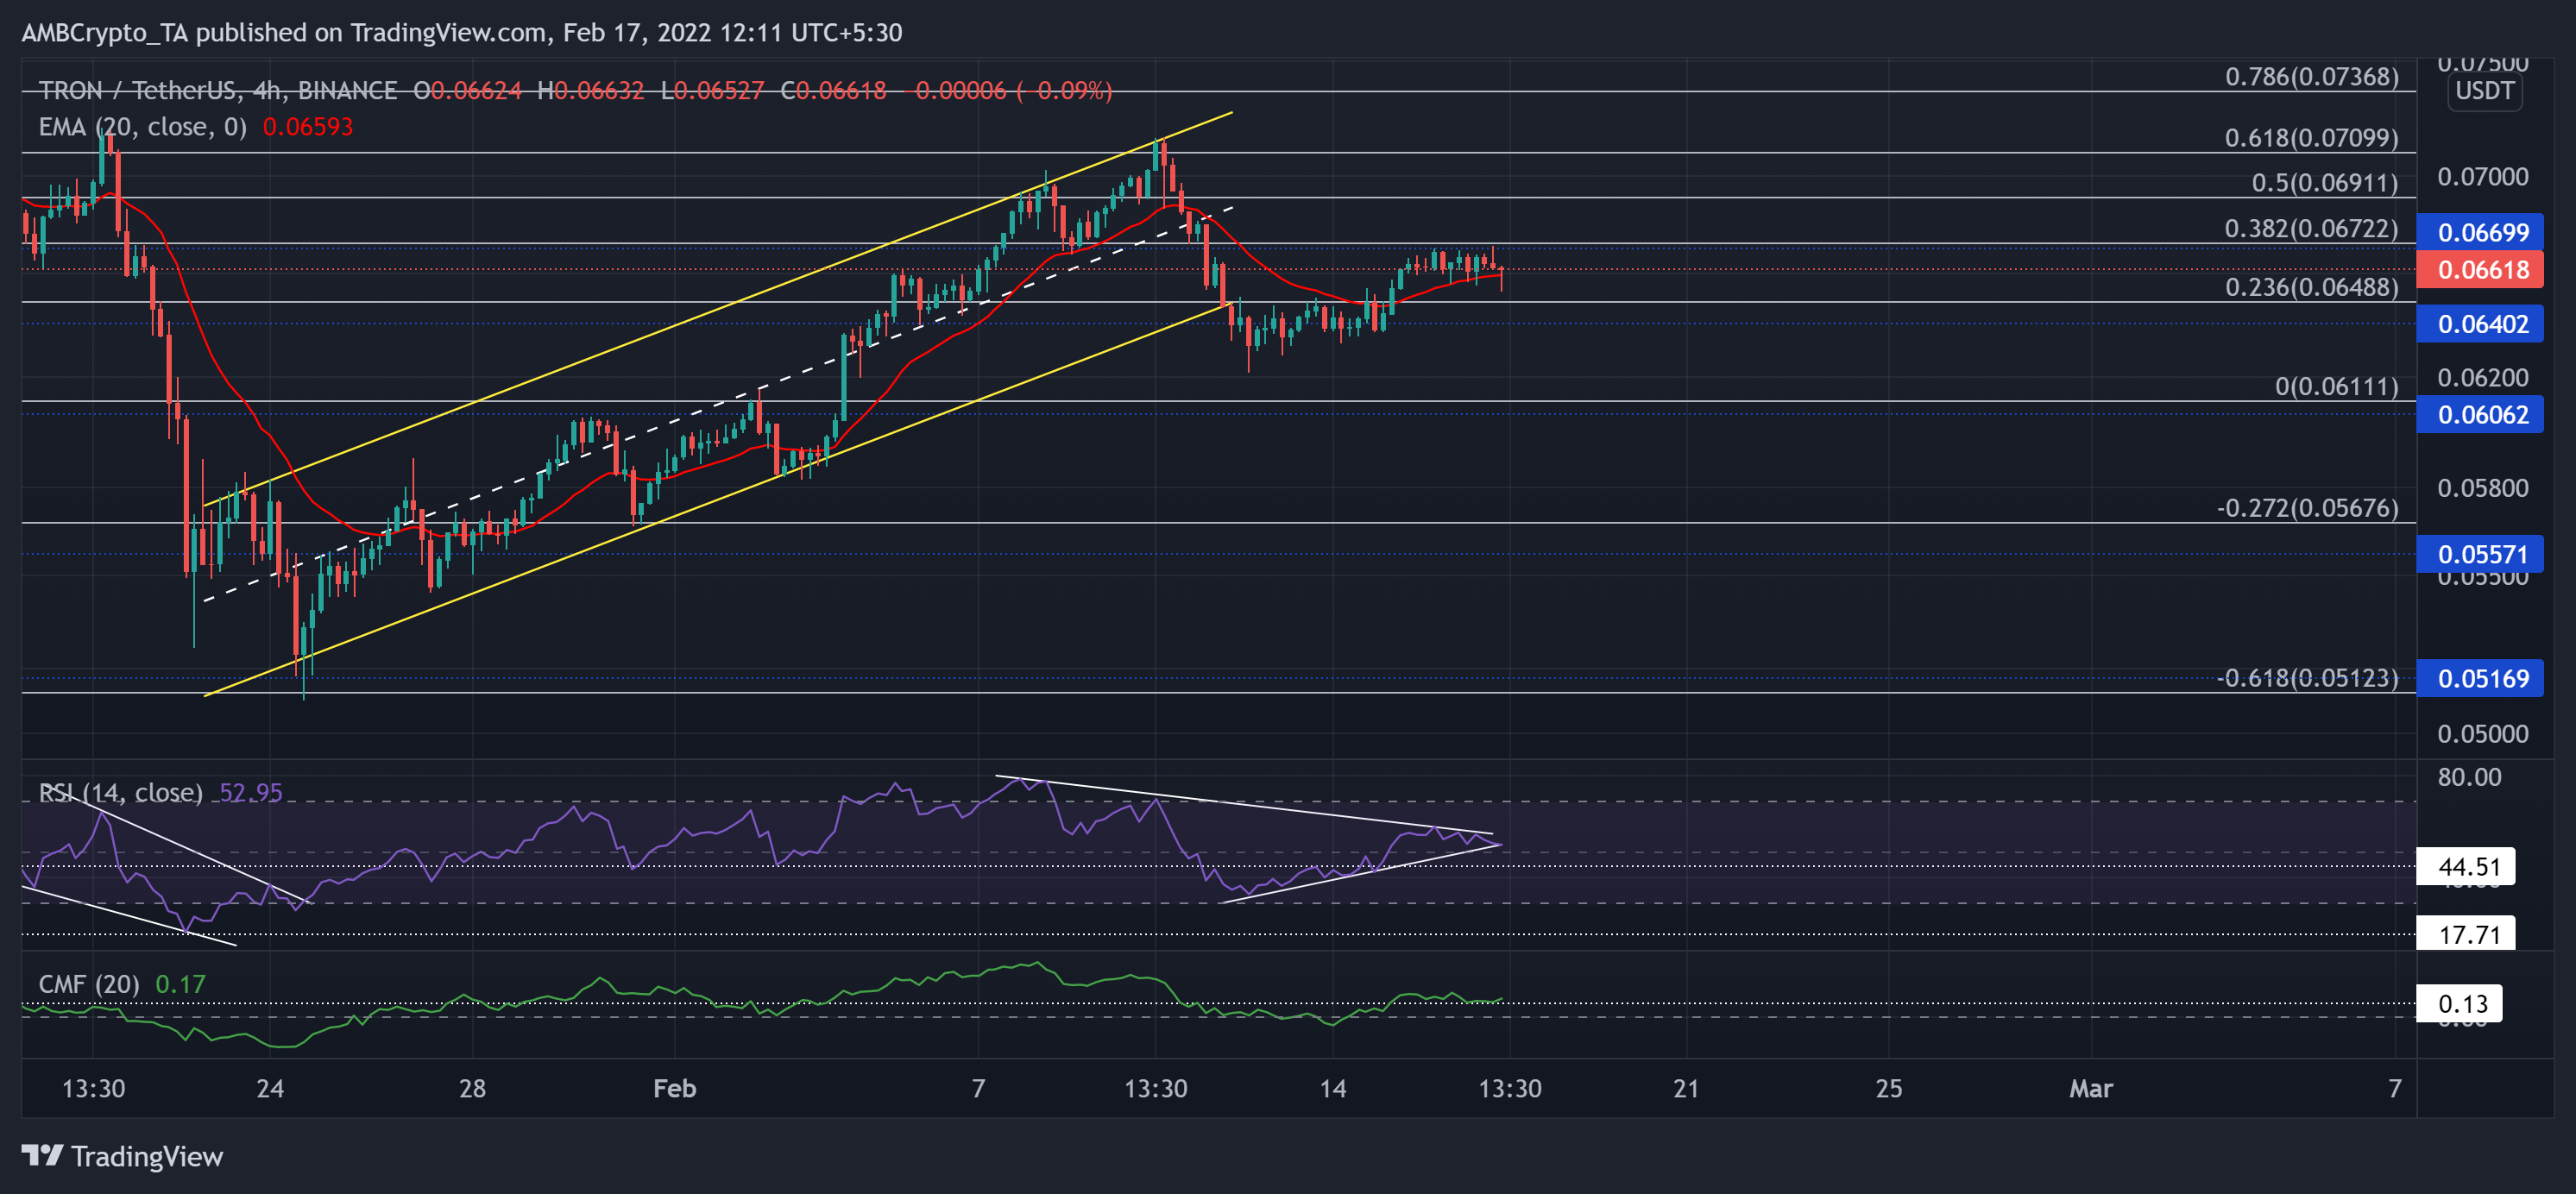
TRX witnessed a substantial 30% drop from (20 January) and touched its six-month low mark on 24 January. Since then, the alt recovered in an ascending channel (yellow) on its 4-hour chart.
It registered a nearly 40% gain to retest the golden Fibonacci level on 10 February. Since testing this level, it saw a pullback while breaking out of the pattern. Nevertheless, the $0.064 support stood sturdy while the bears upheld the 38.2% resistance. Any close below its 20 EMA (red) could propel a retest of the $0.064-mark.
At press time, TRX traded at $0.06618. The RSI was on a downtrend for the past ten days. The bulls needed to step in and defend the midline support to prevent a 44-point retest. Interestingly, the CMF revealed a strong bullish edge and affirmed a strong buying momentum while maintaining the 0.13-support.
Fantom (FTM)
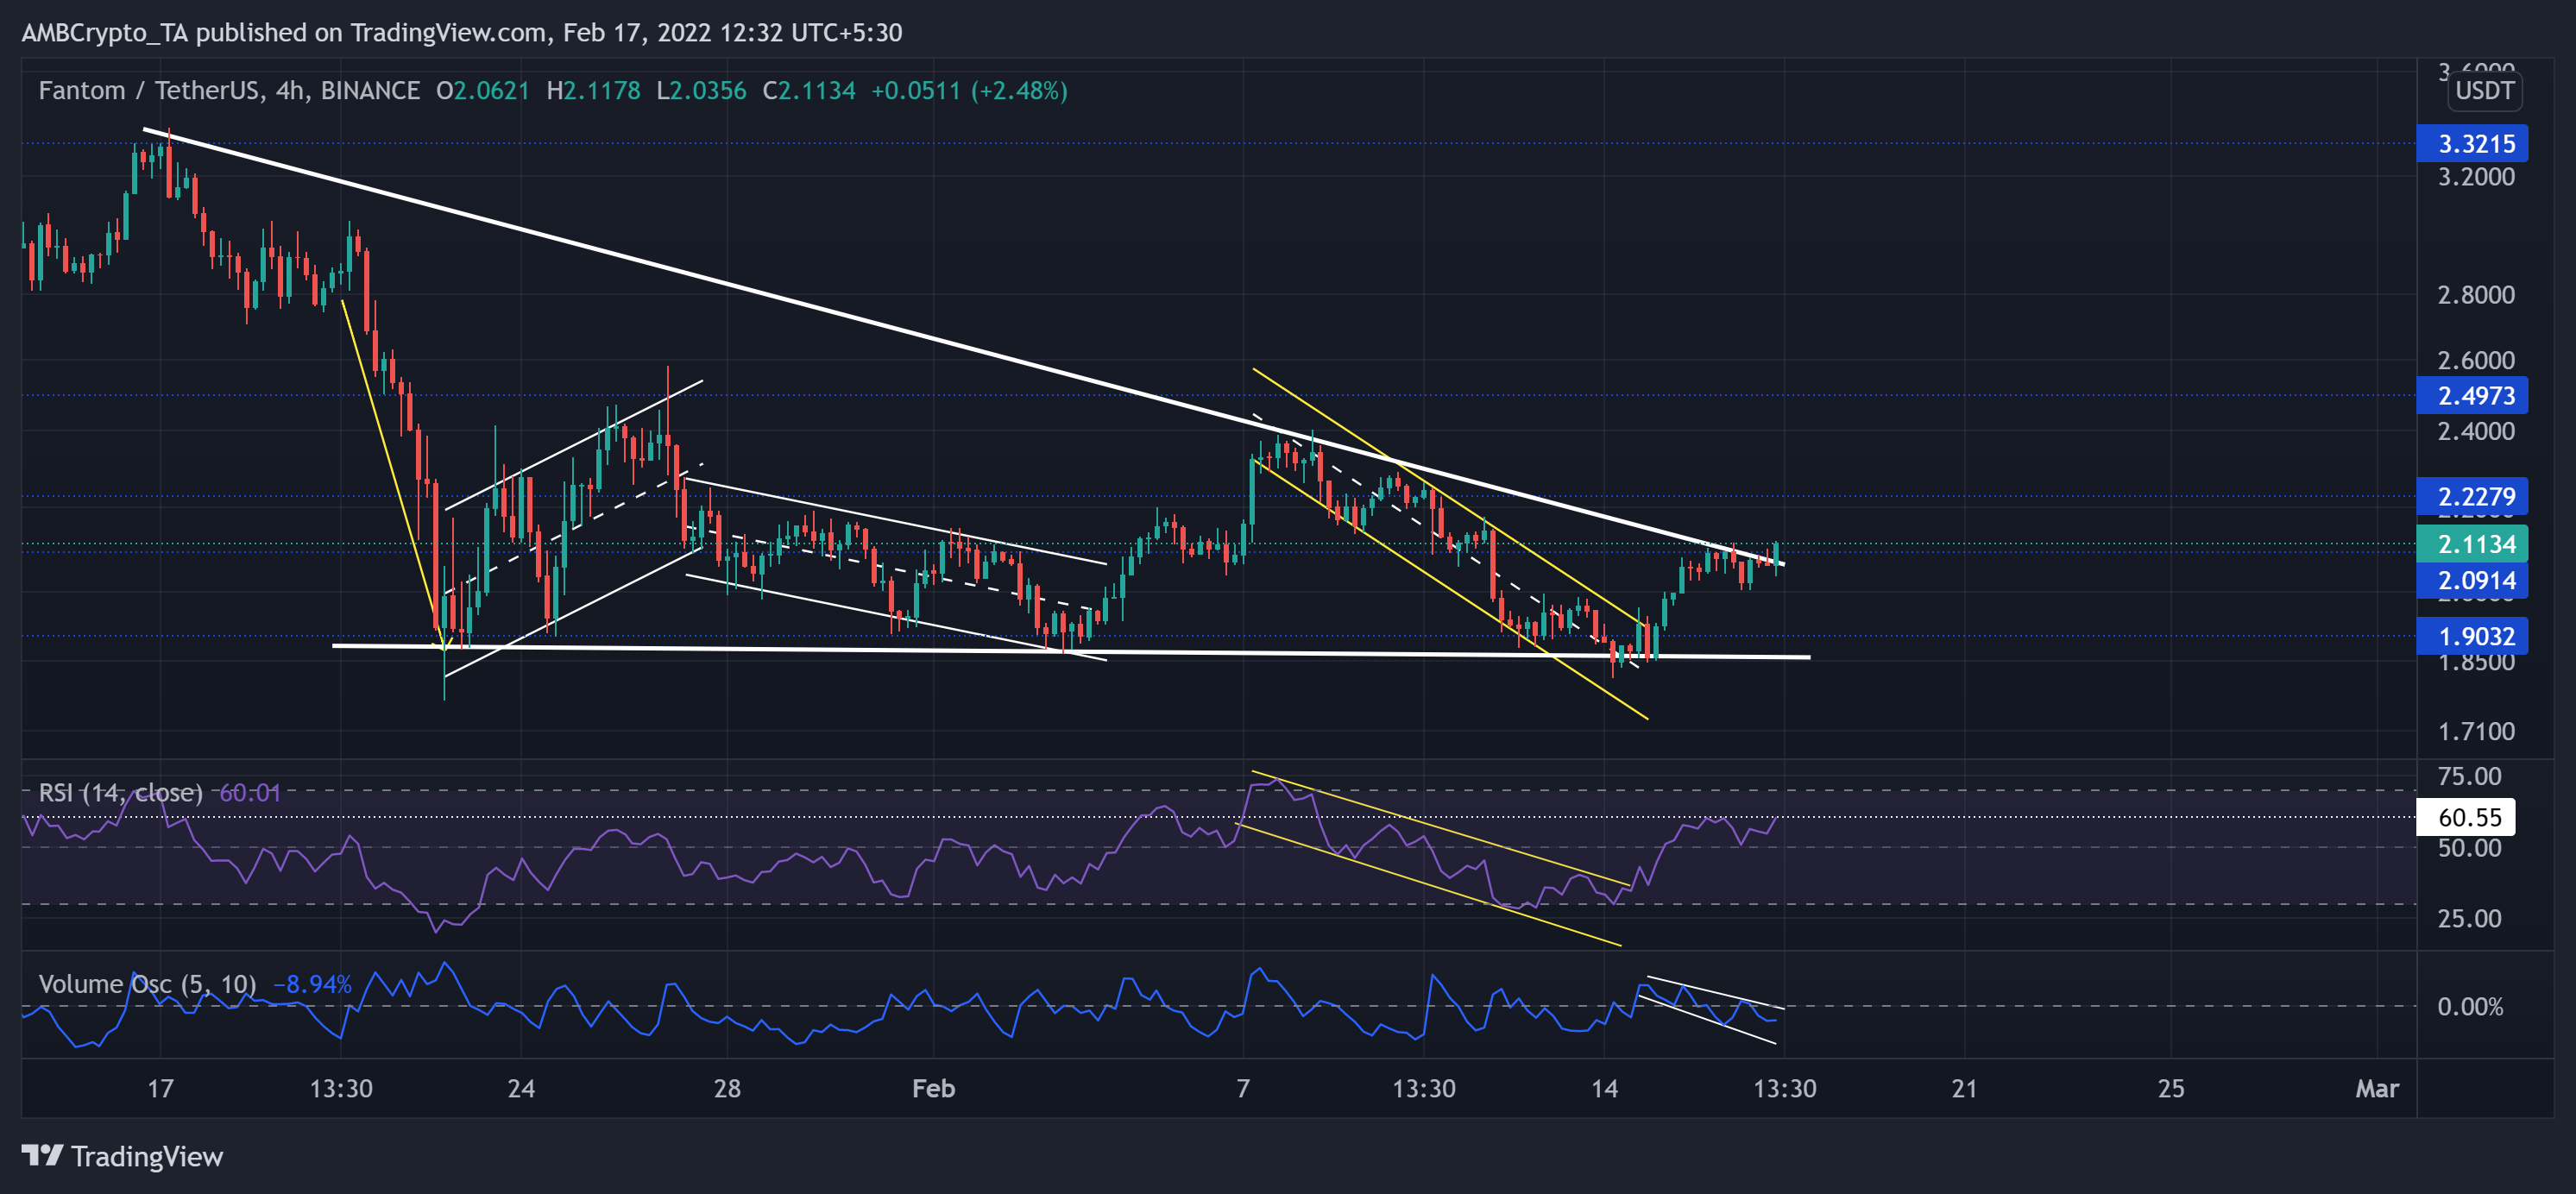
Since FTM reversed from the $3.32-level, the bears were in the driving seat. Consequently, it lost over 47% of its value and hit its one-month low on 24 January.
Since then, the alt was rangebound between the $2.49 and $1.9-mark. The alt saw a month-long trendline resistance (white) while maintaining the $1.9-support. This hinted at bearish tendencies, but the recent down-channel breakout bagged in over 14% gains in just the two days. Thus, FTM breached its trendline resistance near the $2.09-mark. Now, the immediate resistance stood at the $2.22-level.
At press time, FTM traded at $0.0. The RSI saw a rapid recovery from the oversold region. Any close above the 60-point barrier would drive a push toward the overbought territory. However, the recent gains failed to entail increasing volumes, hinting at a weak bullish move.