Bitcoin Cash’s short-term price action depends on this happening

Disclaimer: The findings of the following analysis are the sole opinions of the writer and should not be taken as investment advice
A brief period of recovery kicked off last week, one which saw Bitcoin Cash rise towards the $540-mark after bouncing back from $460. However, sellers gained market control later as BCH’s value steadily declined by 12% over the past few days.
BCH’s price, at press time, was within a down-channel, but finding support at certain levels would still back a bullish narrative moving forward. At the time of writing, BCH was being traded at $481, down by 3.5% over the last 24 hours.
Bitcoin Cash 4-hour
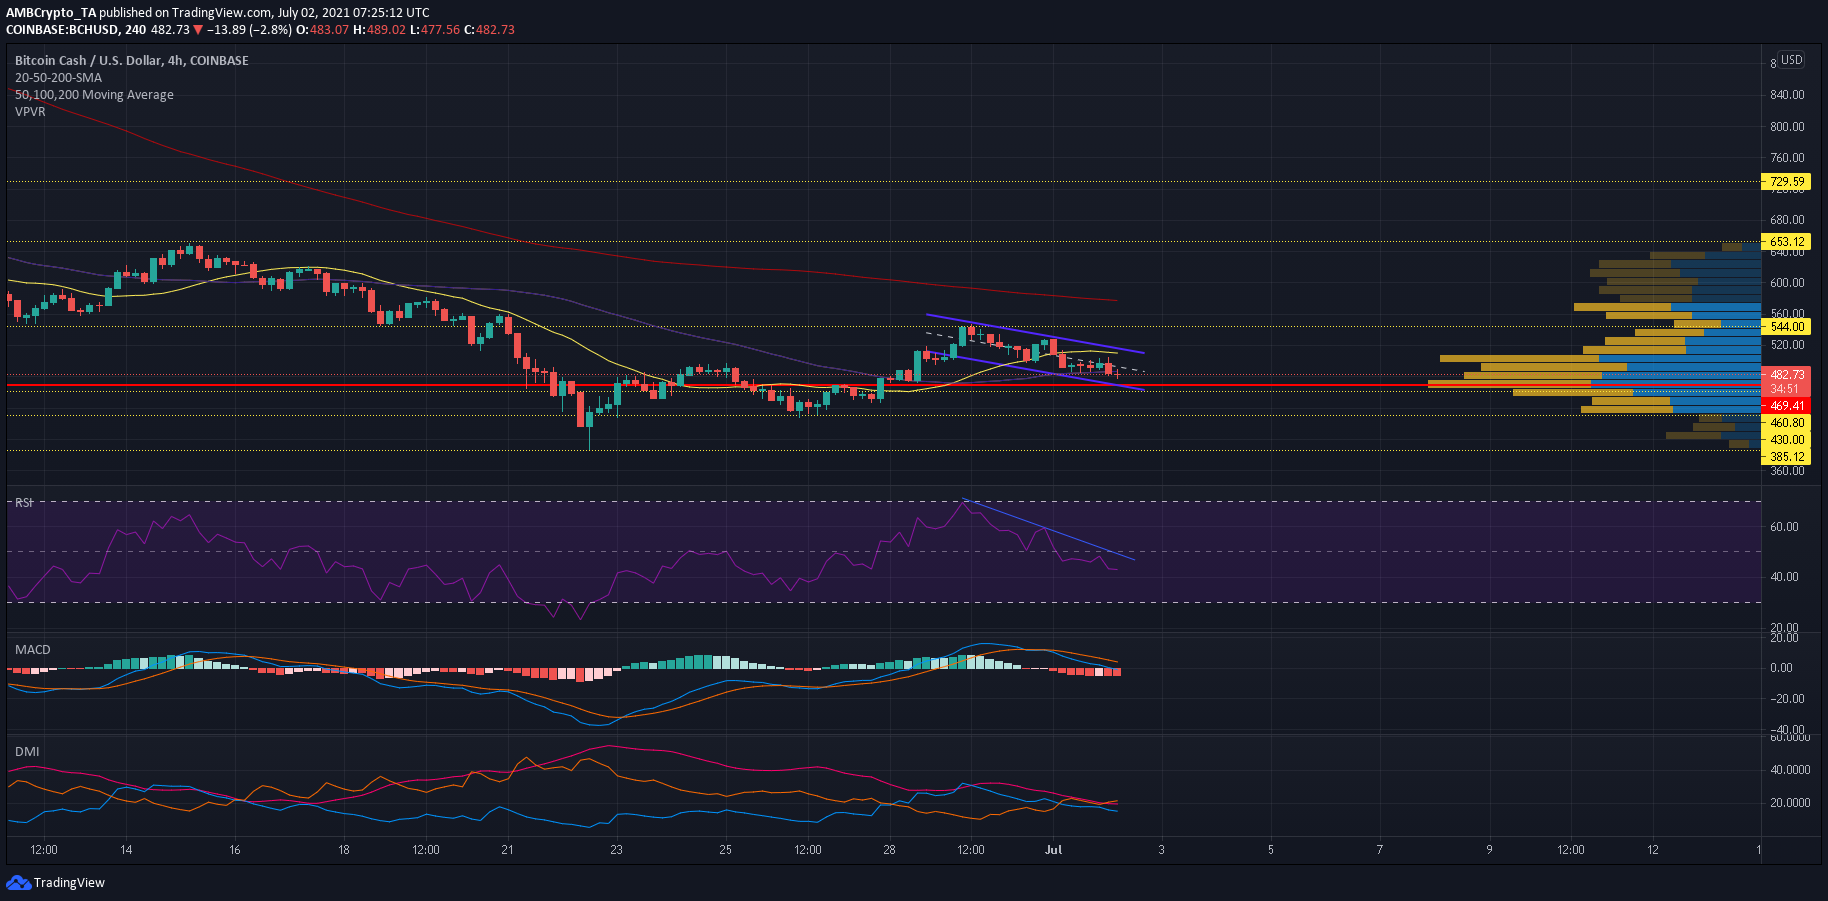
Bitcoin Cash’s rally towards its overhead resistance of $544 was promising, but a false breakout above its 100-MA (blue) saw the price trend lower once again. A down-channel formed as BCH eventually slipped below its 20 (yellow) and 50 (purple) Simple Moving Average Lines. What’s more, the price, at the time of writing, was moving closer to the defensive line at $460 and stopping losses within this region could still allow for a bullish outcome over the next few days.
Reasoning
After BCH touched a low of $387 on 22 June, the price formed two higher highs at $500 and $544 and a single lower high. Overall, this represented an uptrend as BCH looked to steadily regain lost ground since the 19 May sell-off. However, alleviating current losses at $460 is imperative to support this narrative. Interestingly, the Visible Range’s POC lay close to this level. However, a close below the aforementioned level could see the price move back towards the $430 defense – A region that triggered BCH’s most recent rally.
The Relative Strength Index was in the bearish-neutral territory, but was pointing south and highlighted some more downside. The Directional Movement Index underlined a bearish trend as the -DI moved back above the +DI. The diverging nature of these lines hinted that the bearish trend would carry on for a few more sessions. The MACD line threatened to drop below equilibrium as bearish momentum was on the up.
Maintaining losses at $460 would likely see BCH trade within its down-channel, where resistance at $500 would likely cap any short-term upside. From there on, a northbound breakout back towards $540 would be a possibility over the coming days.
Conclusion
BCH can trade between a channel of $460-500 over the short-term – A development that would allow for a bullish outcome in the following days. However, there is a chance that the price could fall back towards $430 as the alt’s indicators outlined weakness in the market.


