Bitcoin climbs above $67K: Will BTC cross $100K this time?

- Bitcoin’s price has increased by more than 10% in the last seven days.
- BTC was testing resistance, and a breakout could start another bull rally.
Bitcoin [BTC] surprised investors last week as its price rallied by double digits. The trend sparked excitement in the market as expectations of BTC reclaiming $70k increased.
In fact, if the latest data is to be considered, this possibility doesn’t seem to be a long shot.
Bitcoin to repeat history?
CoinMarketCap’s data revealed that BTC’s price rallied by more than 10% in the last seven days, allowing it to sit above $67k.
At the time of writing, the king of cryptos was trading at $67,115.81 with a market capitalization of over $1.32 trillion.
While BTC’s price action favored the bulls, Titan of Crypto, a popular crypto analyst, recently posted a tweet highlighting an interesting development.
As per the tweet, BTC was targeting the upper line of its realized price. If this translates into reality, then investors might witness BTC run above $100k in the coming weeks.
The possibility of that happening was likely, as similar episodes happened in the past. To be precise, Bitcoin has touched the upper line of its realized price during each and every cycle in the past.
Things in terms of on-chain metrics also looked pretty optimistic for Bitcoin.
AMBCrypto’s analysis of CryptoQuant’s data revealed BTC’s net deposit on exchanges was dropping, hinting at low selling pressure.
Its MPI was green, meaning that miners were selling fewer holdings compared to its one-year average. However, at press time, BTC’s aSORP was red, suggesting that more investors were selling at a profit.
In the middle of a bull market, it can indicate a market top.
What to expect in the short term?
Apart from aSORP, a few other metrics also raised red flags. For instance, AMBCrypto’s analysis of Glassnode’s data revealed that BTC’s accumulation trend score had a value of 0.0107.
The accumulation trend score is an indicator that reflects the relative size of entities that are actively accumulating coins on-chain in terms of their BTC holdings.
A value closer to 0 means that investors are distributing or not accumulating BTC.
Apart from this, BTC’s fear and greed index had a value of 72. This meant that the market was in a “greed” phase, which often results in price corrections.
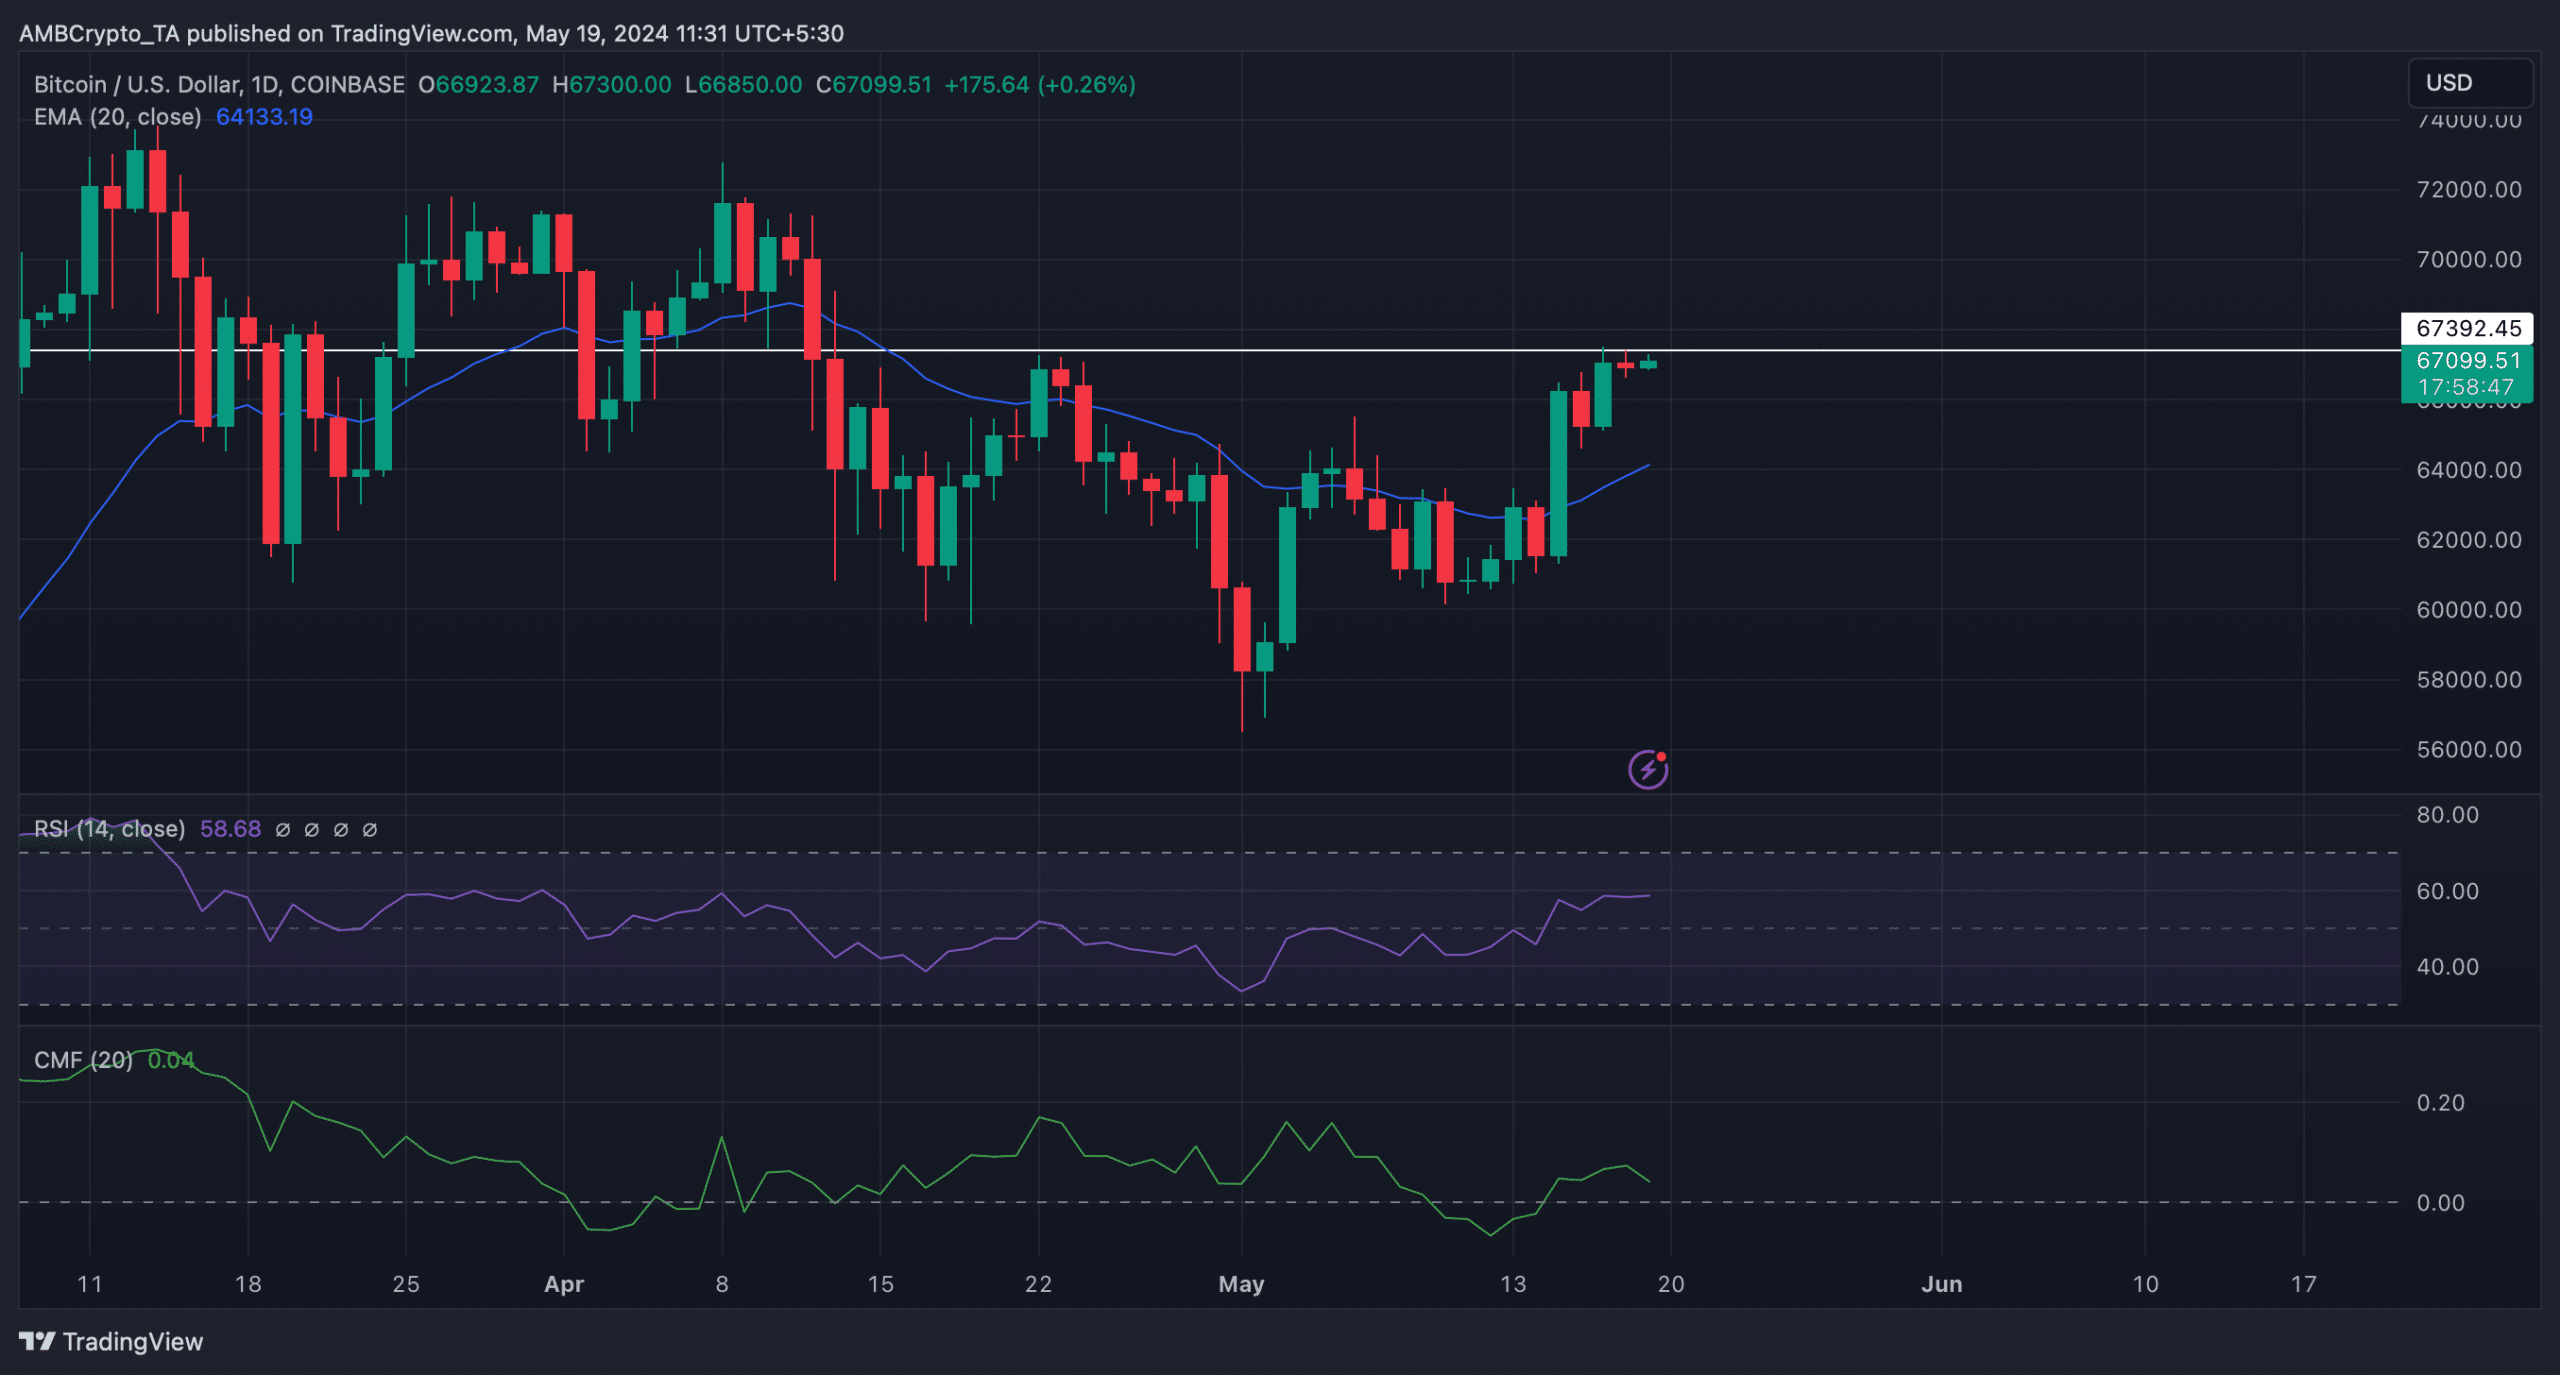
So, AMBCrypto analyzed BTC’s daily chart to see which direction it was headed in the short-term. We found that BTC was testing its resistance at the $67.3k mark at press time.
Likewise, its price remained above its 20-day Exponential Moving Average (EMA).
Read Bitcoin’s [BTC] Price Prediction 2024-25
Additionally, its Relative Strength Index (RSI) also registered an uptick, suggesting that BTC might flip its resistance into its support. If that happens, then things will remain bullish in the near term.
Nonetheless, the Chaikin Money Flow (CMF) went southward, hinting at a price correction soon.


