Bitcoin, Ethereum and MATIC Price Analysis: 12 August

The overall crypto market witnessed price growths in correspondence to BTC and ETH’s rally over the past few days. At press time, both BTC and ETH experienced a pullback in prices as buying strength fell. Despite the correction, BTC traded above the support level of $45,500 but ETH fell through the $3,160 support level. Lastly, MATIC remained bullish as it could attempt to touch its resistance level of $1.42.
Bitcoin
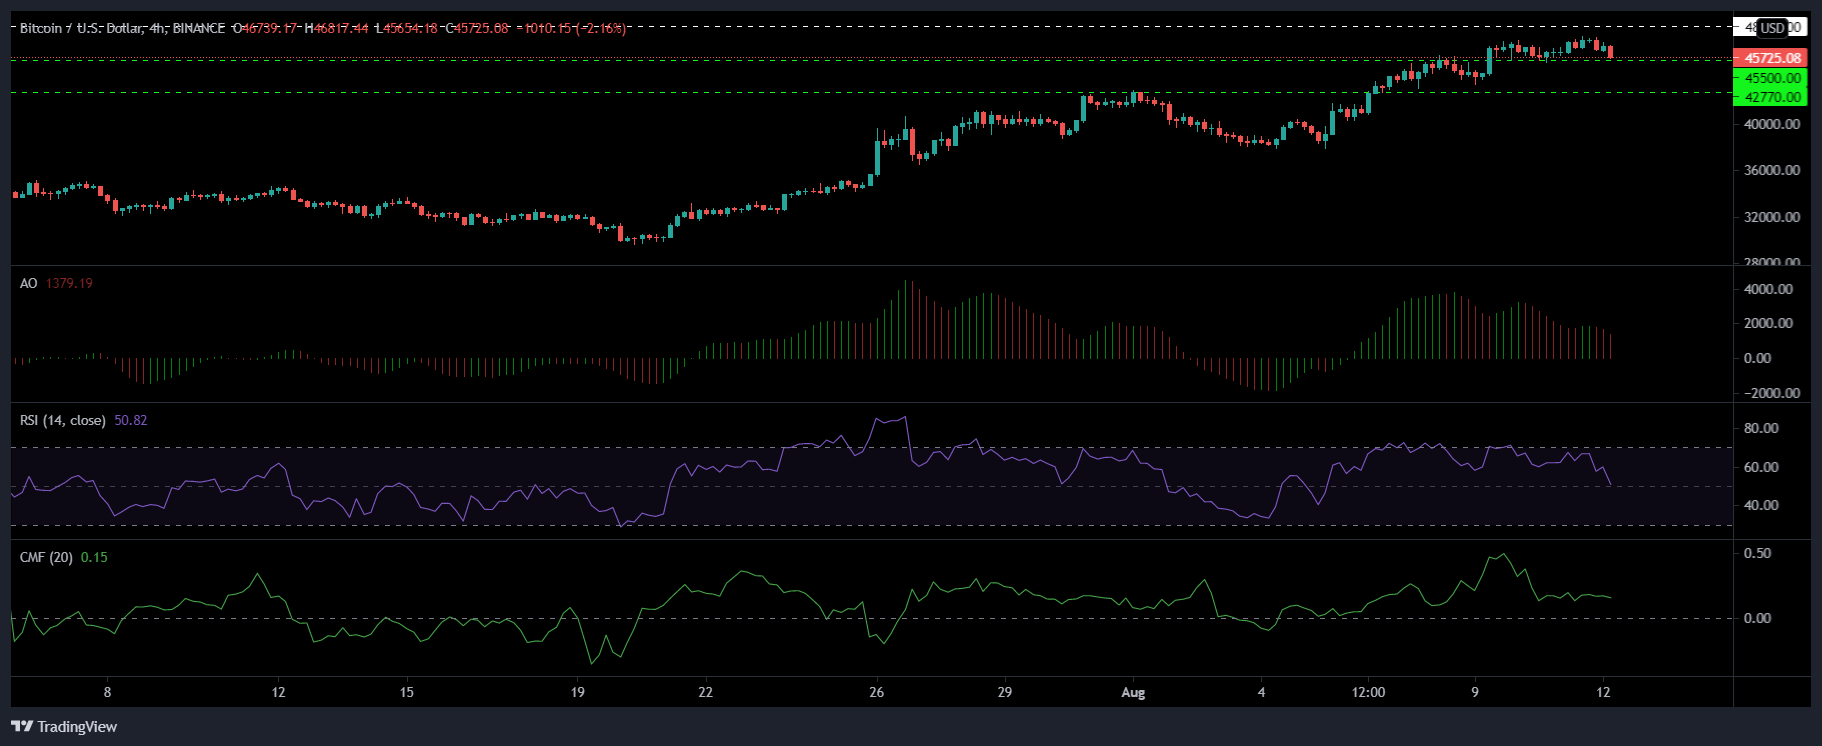
Amidst developments related to the US infrastructural bill, Bitcoin rallied and surpassed its three-month high as prices touched $46,060 just three days ago. It has been on a bullish ride ever since then, however, today at press time, the crypto asset stood at $45,727 after registering a loss of 2% over the last 24 hours.
Relative Strength Index moved south near the midline, indicating an even buying and selling pressure. Bearish pressure seemed to be building as seen on Awesome Oscillator. Chaikin Money Flow correspondingly highlighted a fall in capital inflows over outflows. The next support level for BTC in case it falls through its $45,500 support line lay at $42,770.
Since the bears have obstructed the rally it is vital for Bitcoin to stay above the $45,500 to try attempting to touch the $48,400 resistance mark.
Ethereum
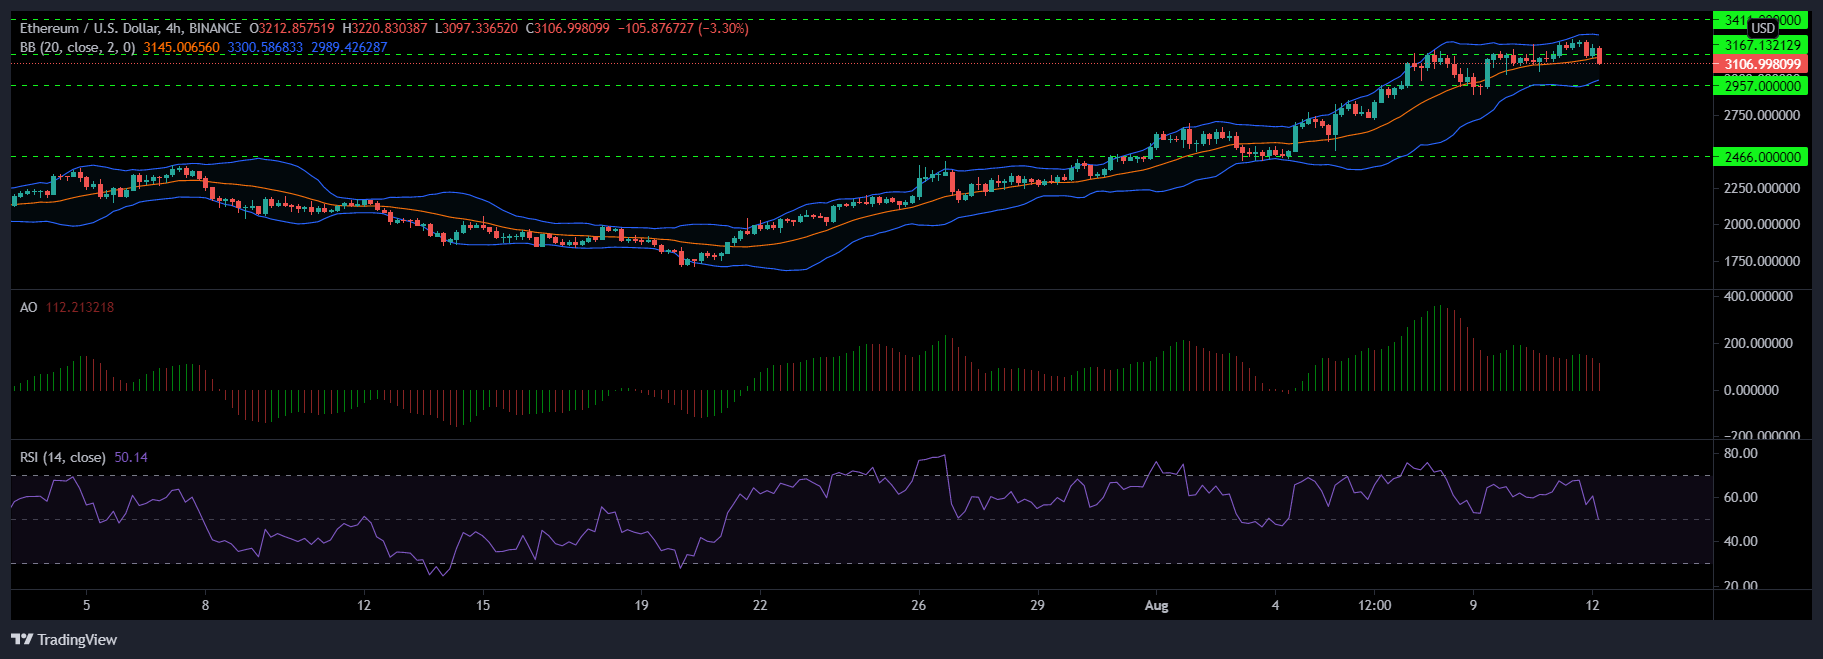
Ethereum’s uptrend was stalled after it recorded a 2.7% fall in prices over the last 24 hours. At the time of writing, ETH was trading for $3,106 and it fell through its support level of $3,167. A further push from the bears would mean ETH trading around the support region of $2,957. An inability to stabilize in this region could land ETH further below at $2,466.
Technicals point towards a fall in buying strength; Relative Strength Index traded at the midline as it indicated a neutral buying and selling pressure in the market. Red signal bars on Awesome Oscillator also depict a resurgence of bearish force.
Lastly, Bollinger Bands remained narrow and implied minimal market volatility. In case, price stabilises around the current level, bulls could find the strength to push ETH to $3,411.
MATIC
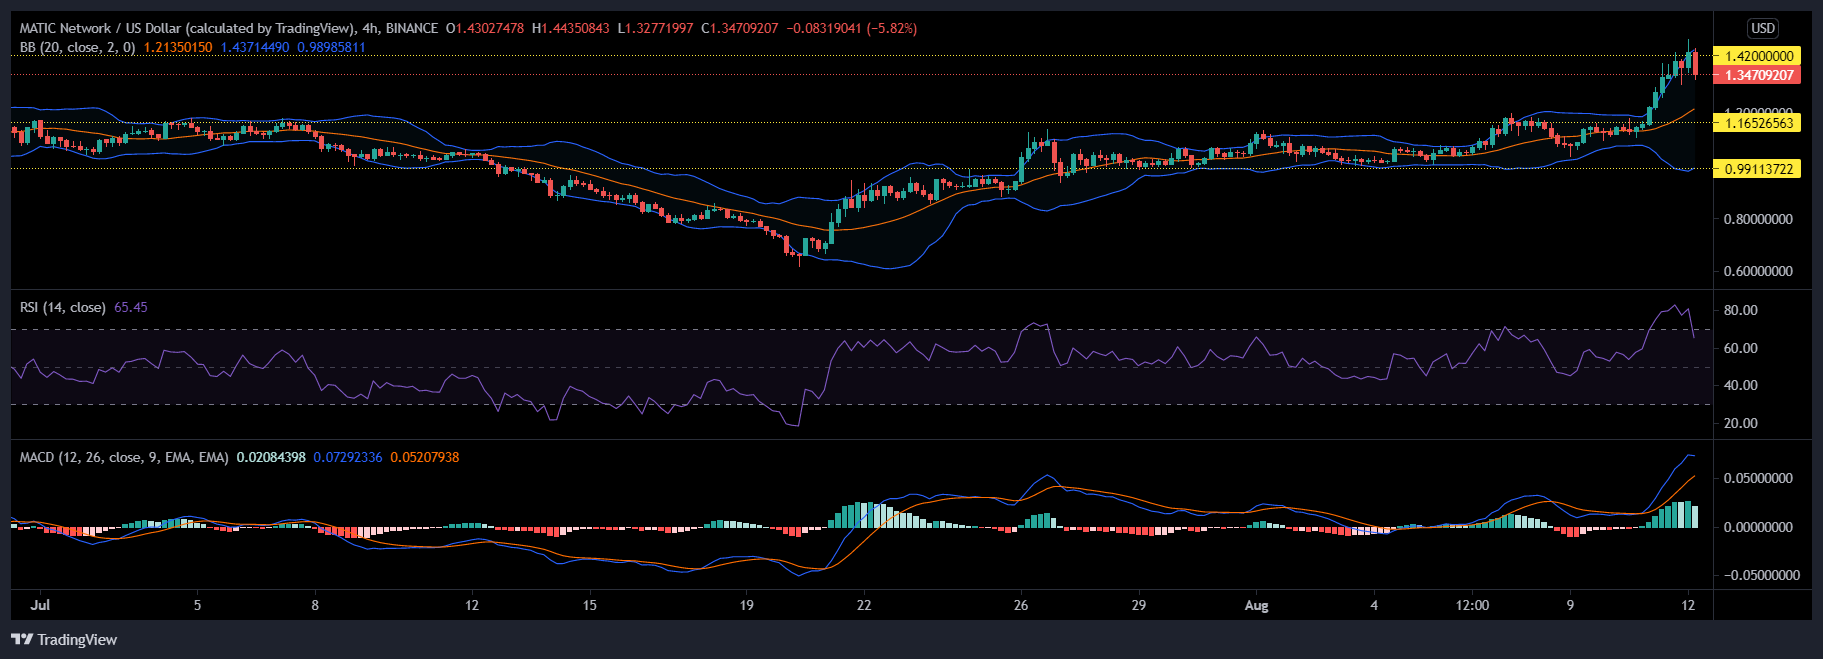
MATIC has held onto its bullish stance, unlike Bitcoin and Ethereum. It was valued at $1.34 at press time, it registered a 7% gain over the last 24 hours. With sustained upward momentum, the asset could test the $1.42 ceiling level for the second time, as it did yesterday. The technical outlook for MATIC remained quite bullish.
Relative Strength Index gave a bullish reading of 68, indicating a high concentration of buyers in the market. MACD substantiated the same by noting strength in the number of green histograms.
Conversely, diverged Bollinger Bands suggested increased market volatility over the upcoming trading sessions.