Bitcoin: Everything you need to know about the ‘Magnificent F#^%ery’

In the words of Michael van de Poppe, “Magnificent fuckery going on today on crypto and Bitcoin”, that does seem to be the case as Bitcoin in the late hours of June 22, fell below $29,000 and created a new wave of panic in the market. Analysts and traders had been holding $29k as an important support level ever since BTC started to fall. While the king coin did bounce back in a very short span to trade at $34,156 at the time of this report, it established new important levels in the market.
How much lower can Bitcoin go?
Since the BTC market’s volatility has roused every investor, analysts have lost hope in the coin to maintain close support. As the coin reached a low of $28,800 yesterday, it negated all gain that the coin had made since the beginning of 2021. At the start of this year, BTC was at $29,400 and as the coin fell below that point, $24k was seen as the only strong support going forward. Michael van de Poppe furiously tweeted,
“Let’s have that final crash to $24K and get over it #Bitcoin [sic].”

Next critical support level | Source: Michaël van de Poppe
However, this dip helped identify the next important levels for Bitcoin. According to Poppe $35,500 is the next crucial breaker. This is because the previous breakout, in Feb 2021, occurred at the same mark. For the coin to engage in a solid bull run, BTC will have to breach that level.
In another story, the dip confirmed the speculated head and shoulder (HnS) formation as the fall helped establish an accurate neckline. According to popular trader DonAlt, the HnS pattern created the neckline at $32,000. Historically, the neckline has been observed to mark an important breakout level as the coin usually bounces upwards from it. Nonetheless owing to the volatility, the range between $20k and $32k can rustle Bitcoin’s movement in either direction.

BTC Head and Shoulder formation | Source: DonAlt
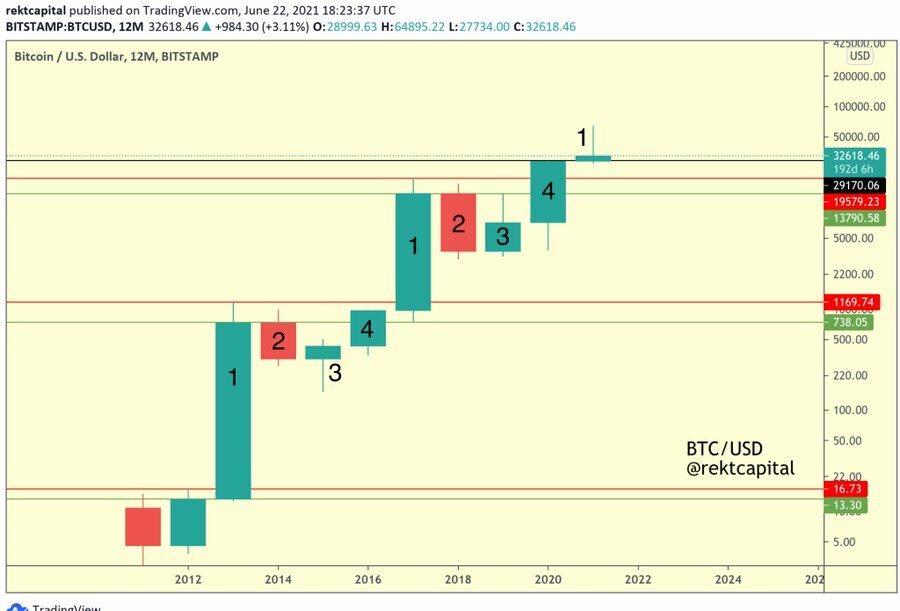
In an interesting development, Bitcoin’s present movement seemed to have negated the June 19 death cross’s effect. Trader and analyst Rekt Capital brought this to attention, as the 4-year cycle (4YC) begins to move in ways expected but not as the death cross suggests.
Based on previous observations, the recent death cross should have had BTC retrace towards the $18k – $20k levels. Even though the levels do represent the 4-year cycle level (red line), in order to reach them, BTC will have to lose the active 4YC level of $29,000 (black line).

The 4-year cycle pattern | Source: Rekt Capital
Why is everyone selling?
Following the dip, panic selling ensued and its effects could be observed very clearly on the market. The sudden burst of selling by short-term holders turned in favor of long-term holders as they started accumulating heavily. Similarly, the number of active Bitcoin addresses came down significantly reaching a 14-month low of 43,639.482 (ref. Glassnode 7D MA chart).

Long term and short term holder’s movement | Source: Michaël van de Poppe

Falling Bitcoin active addresses | Source: Glassnode
Moving forward investors should watch the aforementioned levels in determining their stance on buying/selling BTC. Just make sure the volatility doesn’t rattle you.


![Dogecoin [DOGE] drops 16% – But is a $0.25 rally now loading?](https://ambcrypto.com/wp-content/uploads/2025/06/08519350-41B0-4D47-8530-DADB272A4AD3-400x240.webp)
