Bitcoin: Here’s the ‘ticking time bomb’ traders should be aware of

Despite Bitcoin oscillating around the $40,000-mark over the last 48 hours, the outflow of BTC from exchanges continued its downward trend. Over the week, exchange balances have continued to decline to hit a new multi-year low of 13.0% of circulating supply. This pushes exchange balances to levels last seen in February 2018.
While the aforementioned outflow trend has continued to surprise, it has also been interesting to see how Bitcoin outflows played out differently for different exchanges and what affected this behavioral difference.
This article will delve into how differing sentiments and external and geographical factors played out during outflows from some of the top exchanges.
More and more outflows
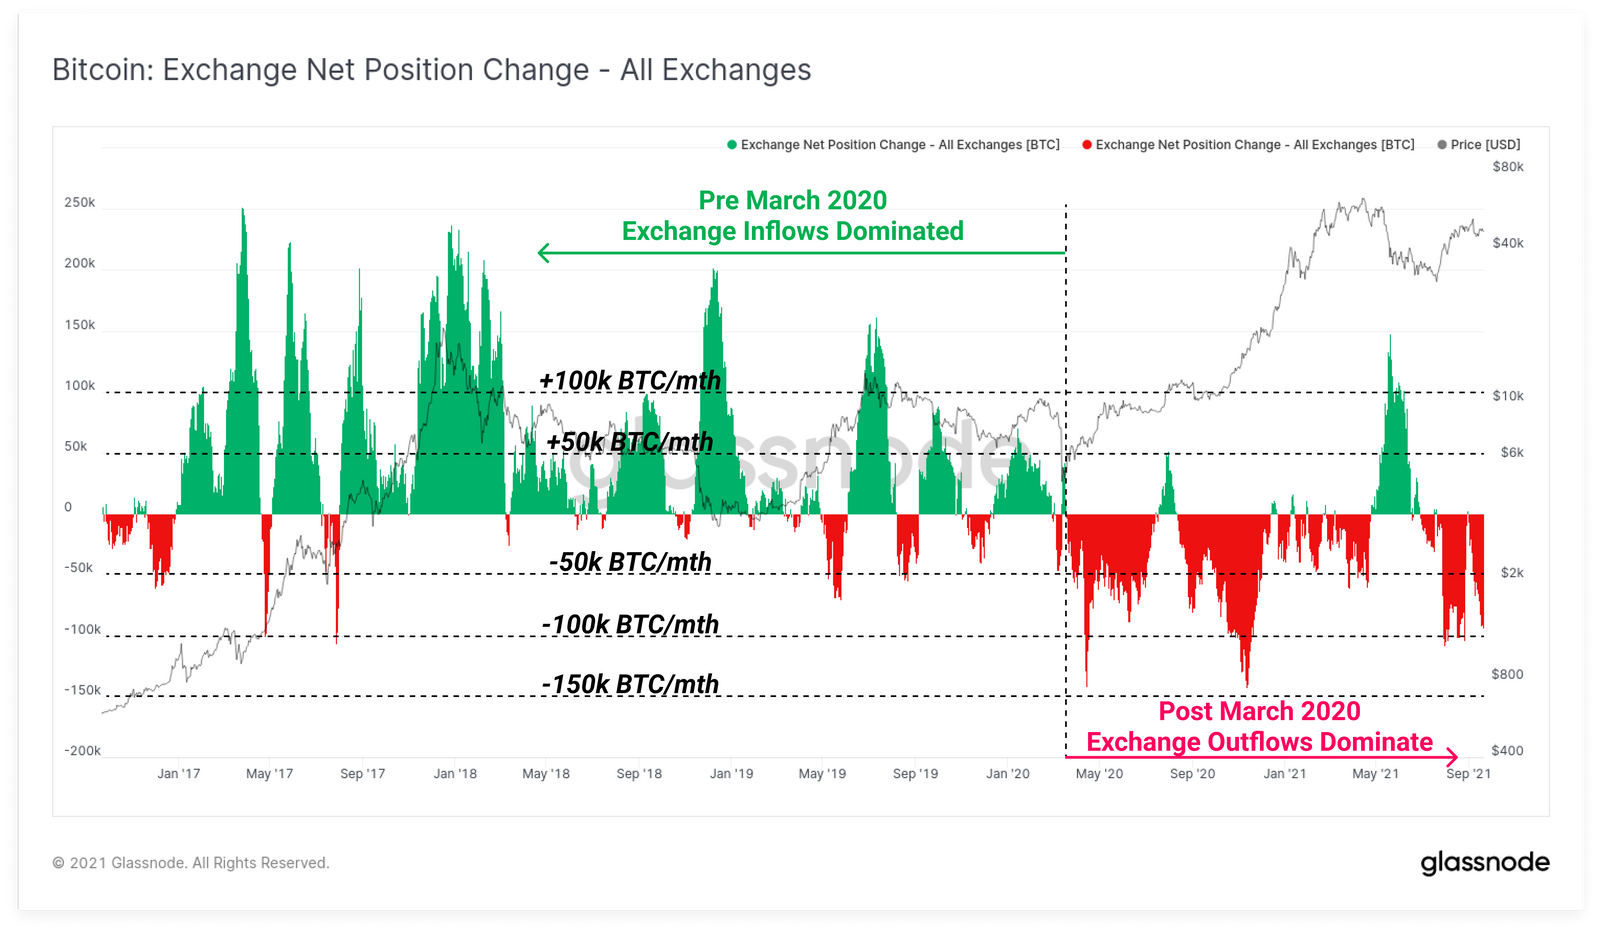
According to a recent Glassnode report, there appears to be more demand for coins accumulated from exchange balances. In fact, the previous week saw a deeply negative (outflows) exchange net-flow reading, with BTC outflows happening at a rate of – 92k BTC/month.
Notably, both exchange balance and exchange net-flow balance highlighted that the market has clearly shifted its paradigm after March 2020. From a regime of net exchange inflow dominance to outflow dominance.
Comparative performance of exchanges
While outflows have been constant across the market, external factors have influenced how exchanges across the spectrum behaved. A characteristic behavior was noted in two cohorts of exchanges –
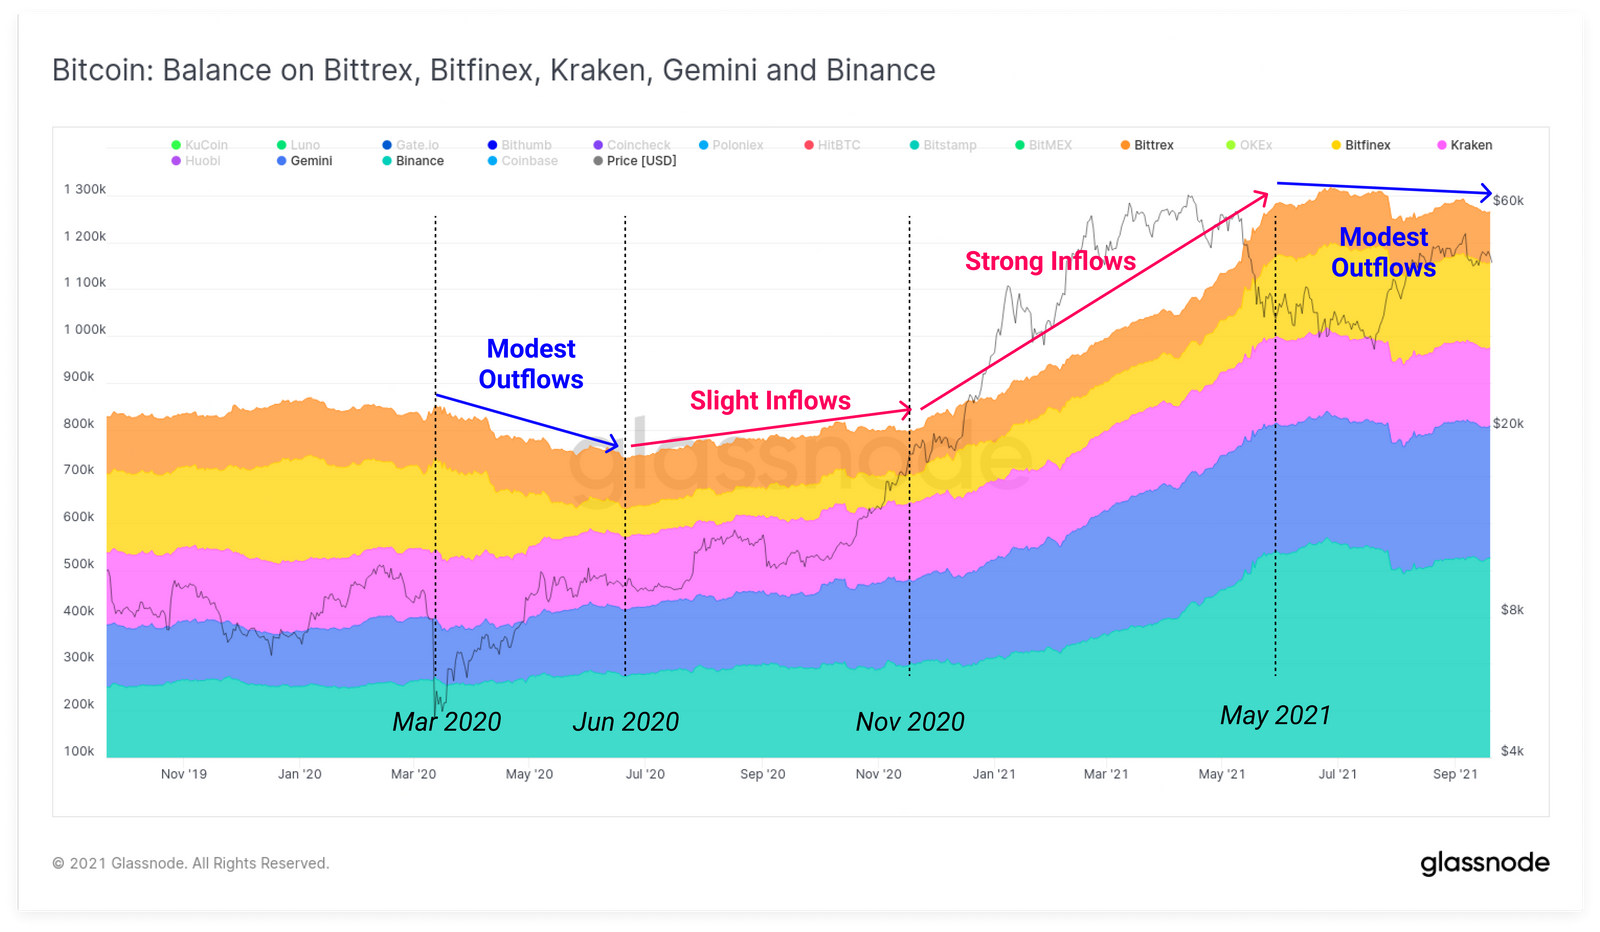
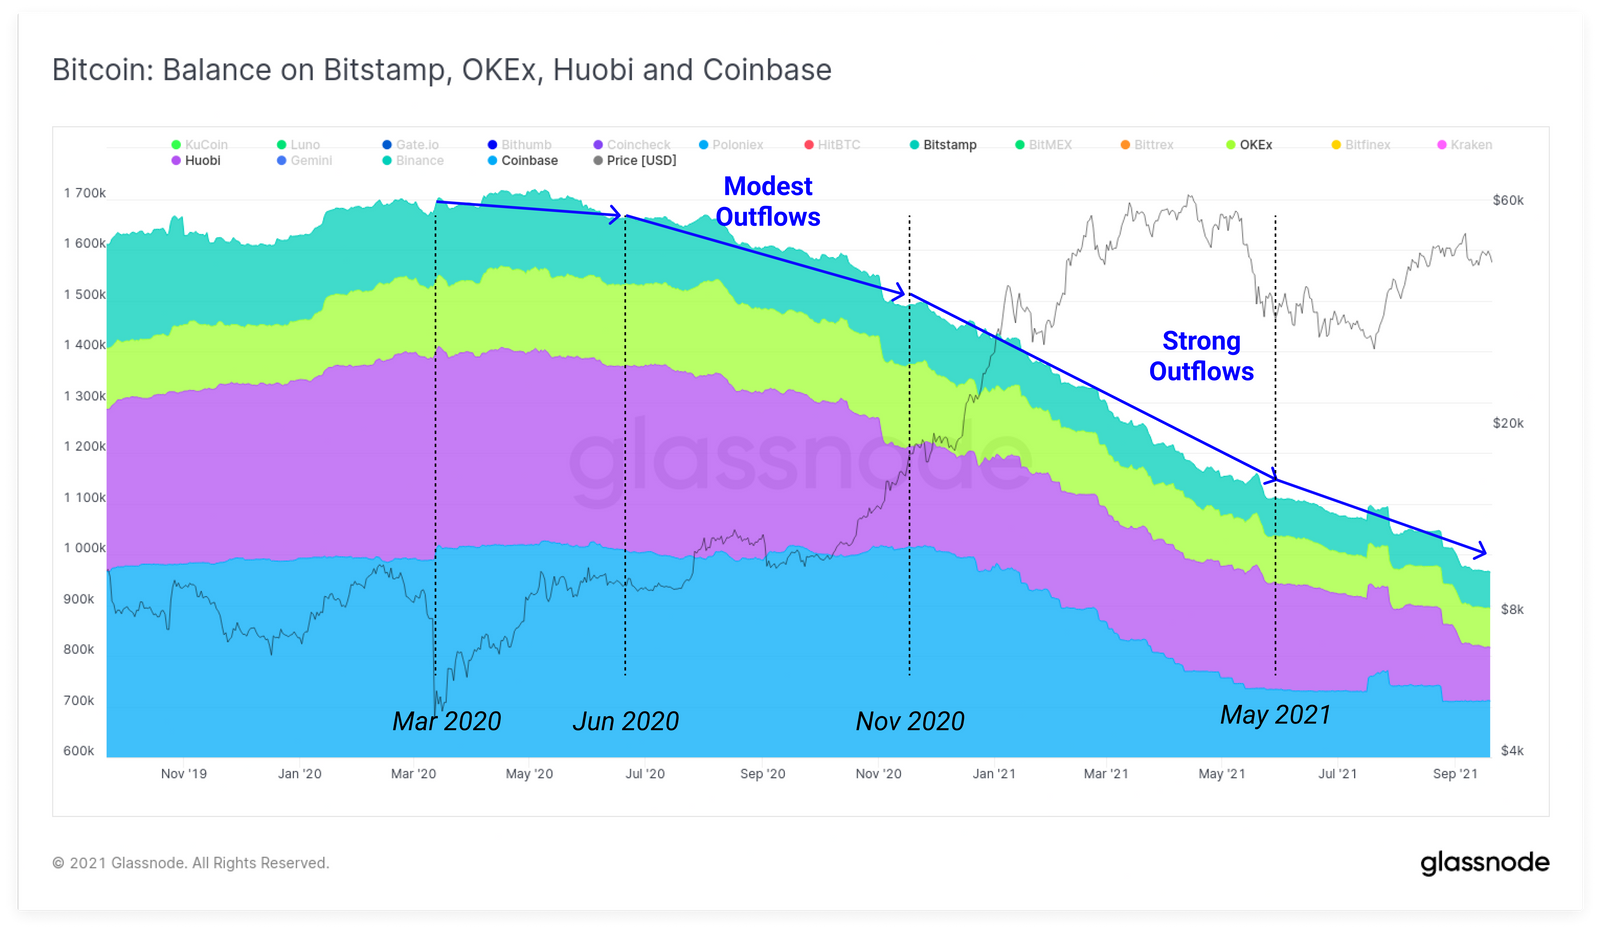
The first cohort of exchanges included Bittrex, Bitfinex, Kraken, Gemini, and Binance. On the contrary, the second included Bitstamp, OKEx, Huobi, and Coinbase.
The first cohort of exchanges demonstrated characteristic inflows and balance growth for most of 2020 and 2021, reflecting a rising dominance in coin holdings.
Binance and Gemini were the primary recipients of this cohort. Post the May sell-offs, balances across this exchange group plateaued and saw modest coin outflows.
On the other hand, the second cohort of exchange saw constant outflows since March 2020. In fact, this has actually accelerated in recent weeks.
Further, the net balance across exchanges has continued to decline as the inflows observed in May were absorbed by the market and moved to investor wallets.
Exchange balance serves as an important metric to gauge traders’ sentiments for the underlying asset. In the case of Coinbase, it’s a hint at its traders’ intention to hold BTC instead of selling it.
Notably, the amount of Bitcoin held in Coinbase Pro’s vaults dropped by 28,843.87 BTC over the last month.
On the other hand, modest outflows from Binance were indicative of the skepticism holders have for BTC’s price. Also, since Binance caters to a more global audience, it can play a part in this trend. The rising Bitcoin balances on Binance were suggestive of its users thinking about selling BTC, the opposite of the trend seen on Coinbase.
In hindsight, it can be noted that on Binance, the Bitcoin balance spiked from 199,700 BTC on 20 April to 347,590 BTC on 26 June – More than 1.5x. During that time, Bitcoin’s price dropped from over $65k to below $30k.
Thus, if the price doesn’t recover soon and outflows don’t dominate on Binance again, the rise in balances could prove to be a ticking time bomb.


