Bitcoin is not repeating history; what’s new about this rally?

Bitcoin, despite the fact that it briefly dropped below $57,000 for a while, has been trading around the $59,000-level for much of the past 24 hours. In fact, a look at the charts would suggest that such rangebound action is meant to precede the crypto’s hike to a new ATH.
This week, Bitcoin’s supply has oscillated between both highs and lows. Now, according to a recent development, top Bitcoin addresses HODLing 100-1,000 BTCs are currently controlling the highest % of supply in 2 years, while Bitcoin addresses HODLing 1,000-10,000 BTCs hit a 5-month low.
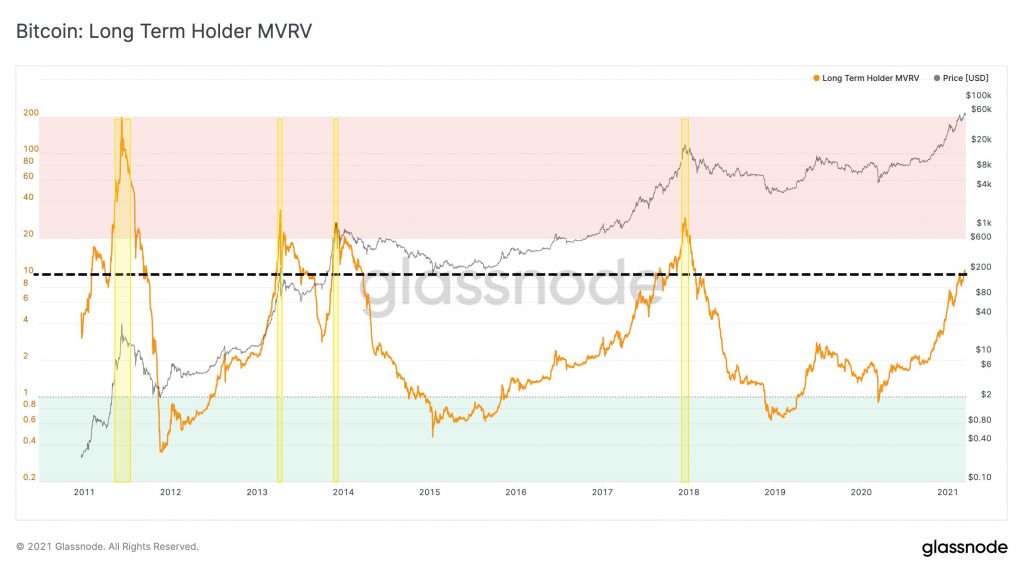
At this point, metrics like Long-Term Holder MVRV can signal the change in sentiment and predict changes in an asset’s price rally. For instance, when the MVRV was at 20+, it was a good indicator of the tops in Bitcoin’s market during previous bull runs.

Source: Twitter
The tops in previous cycles can be represented by the attached chart, with the Long Term Holder MVRV underlining the shift in trends several times over the past decade. From the 2013 price rally to 2017’s short-lived bull run, tops can be clearly found on the charts.
At the time of writing, the MVRV was at 10, half of what 2017’s level was. What does this entail? Well, this suggests that there is room for more upside and northbound movement. Based on the said metric, Bitcoin was trading at $4,500 in 2017 before going up 4.4x to its 2017-peak.
Since there is room for upward growth on the charts right now, the price is likely to cross its ATH again and go on a discovery run. Besides, there are many more similarities in the current cycle and the tops represented on the chart. It is important to note that nearly every top was followed by a massive drop.
A drop that was seen in March 2020 or the likes of it can be expected when the MVRV hits the top this market cycle. However, this is unlikely to happen since the liquidity and investment inflows from institutions are expected to continue. A hike in leverage and demand for Bitcoin Options is currently setting the pace for price growth.
The 2017 cycle relied more on supply and demand metrics on spot exchanges. In the 2017 cycle, there was a steady increase of Bitcoin supply on exchanges with a price rise. However, in the current cycle, there hasn’t been a dramatic increase in supply or the price level. This is unlike the 2017 cycle and therefore, there is a lot more to the current Bitcoin bull run.


