Bitcoin liquidation drops but BTC holds at $60K range – What’s next?
Bitcoin holders who were initially underwater have seen a little relief as the 30-day MVRV climbs above zero.

- Over the past 48 hours, Bitcoin’s liquidation has been below $50 million.
- BTC has held the $60,000 price range.
The past week witnessed a significant decline in Bitcoin’s [BTC] price as it slipped below the $60,000 threshold.
This downturn resulted in a surge of both short and long liquidations, causing some positions to be wiped out.
However, there appears to be a recent equilibrium between price movement and liquidations, suggesting a stabilization in the market.
Bitcoin liquidation declines
AMBCrypto’s analysis of the Bitcoin liquidation chart on Coinglass revealed a surge in liquidation on the 30th of April and the 1st of May.
On the 30th of April, the liquidation volume was over $113 million, with long positions accounting for over $95 million.
This trend continued into the 1st of May, with the liquidation volume surpassing $136 million and long positions representing over $100 million.
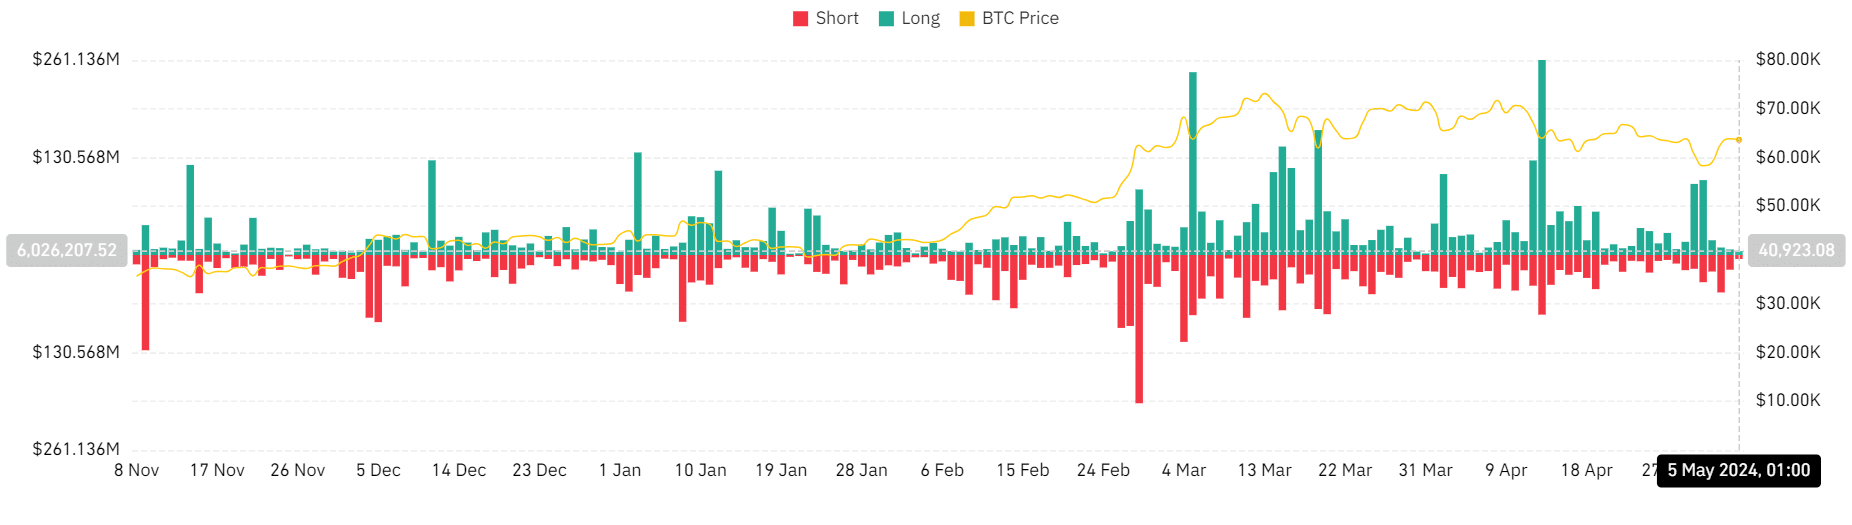
However, as the price of BTC rebounded and reclaimed the $60,000 price range, the liquidation volume began to decline.
Subsequently, since the 2nd of May, the liquidation volume has only exceeded $50 million once. The latest data shows that the liquidation volume was around $10 million at press time.
Bitcoin maintains trend above $60,000
AMBCrypto’s look at Bitcoin’s price trend on the daily timeframe chart indicated a notable rebound following its declines on the 30th of April and the 1st of May, during which it experienced an 8% loss over 48 hours.
AMBCrypto’s chart analysis revealed consecutive uptrends beginning on the 2nd of May, with a notable increase of over 6% observed on the 3rd of May.
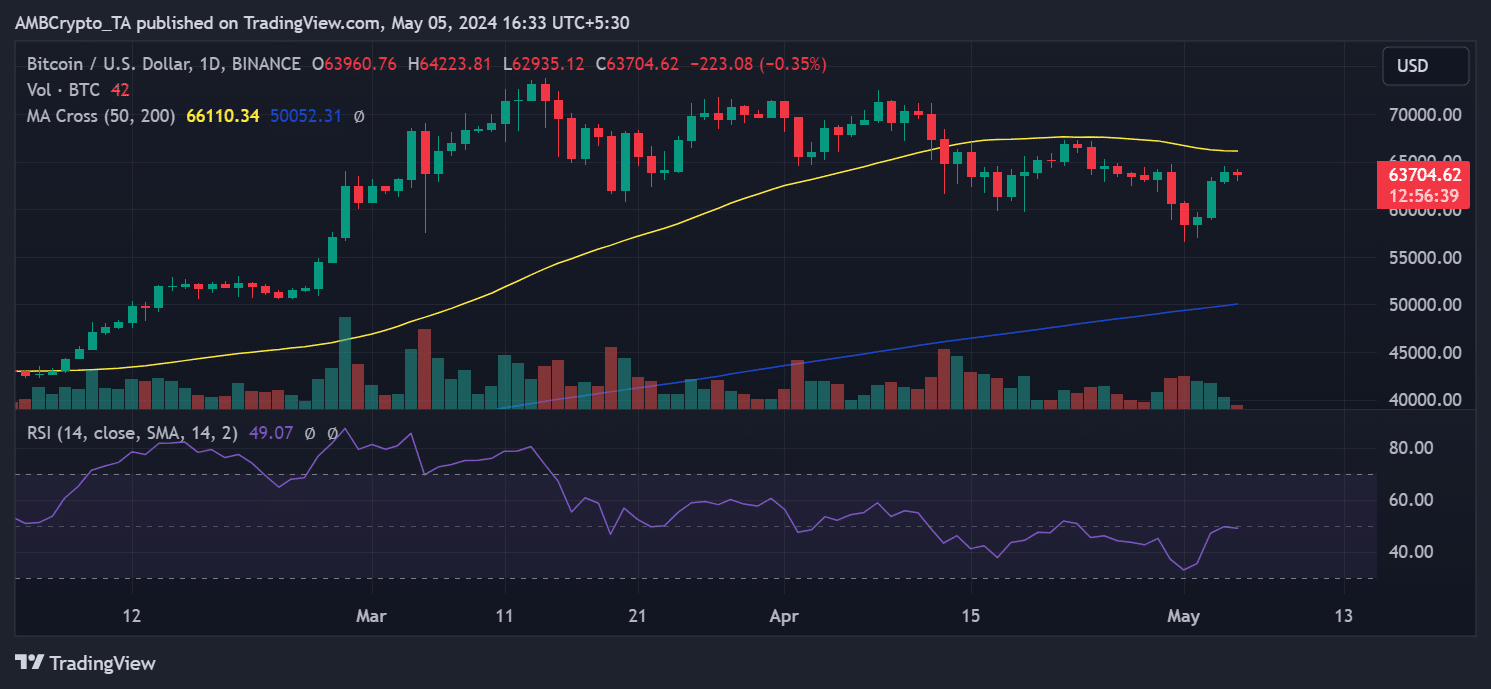
By the end of trading on the 4th of May, Bitcoin had increased by over 1%, reaching approximately $63,900.
As of this writing, it was trading with a decrease of less than 1%, but it still maintained the $63,000 price range.
Despite this rebound, its short moving average (yellow line) continued to serve as resistance at around $66,000.
Strained profit for 30-days holders
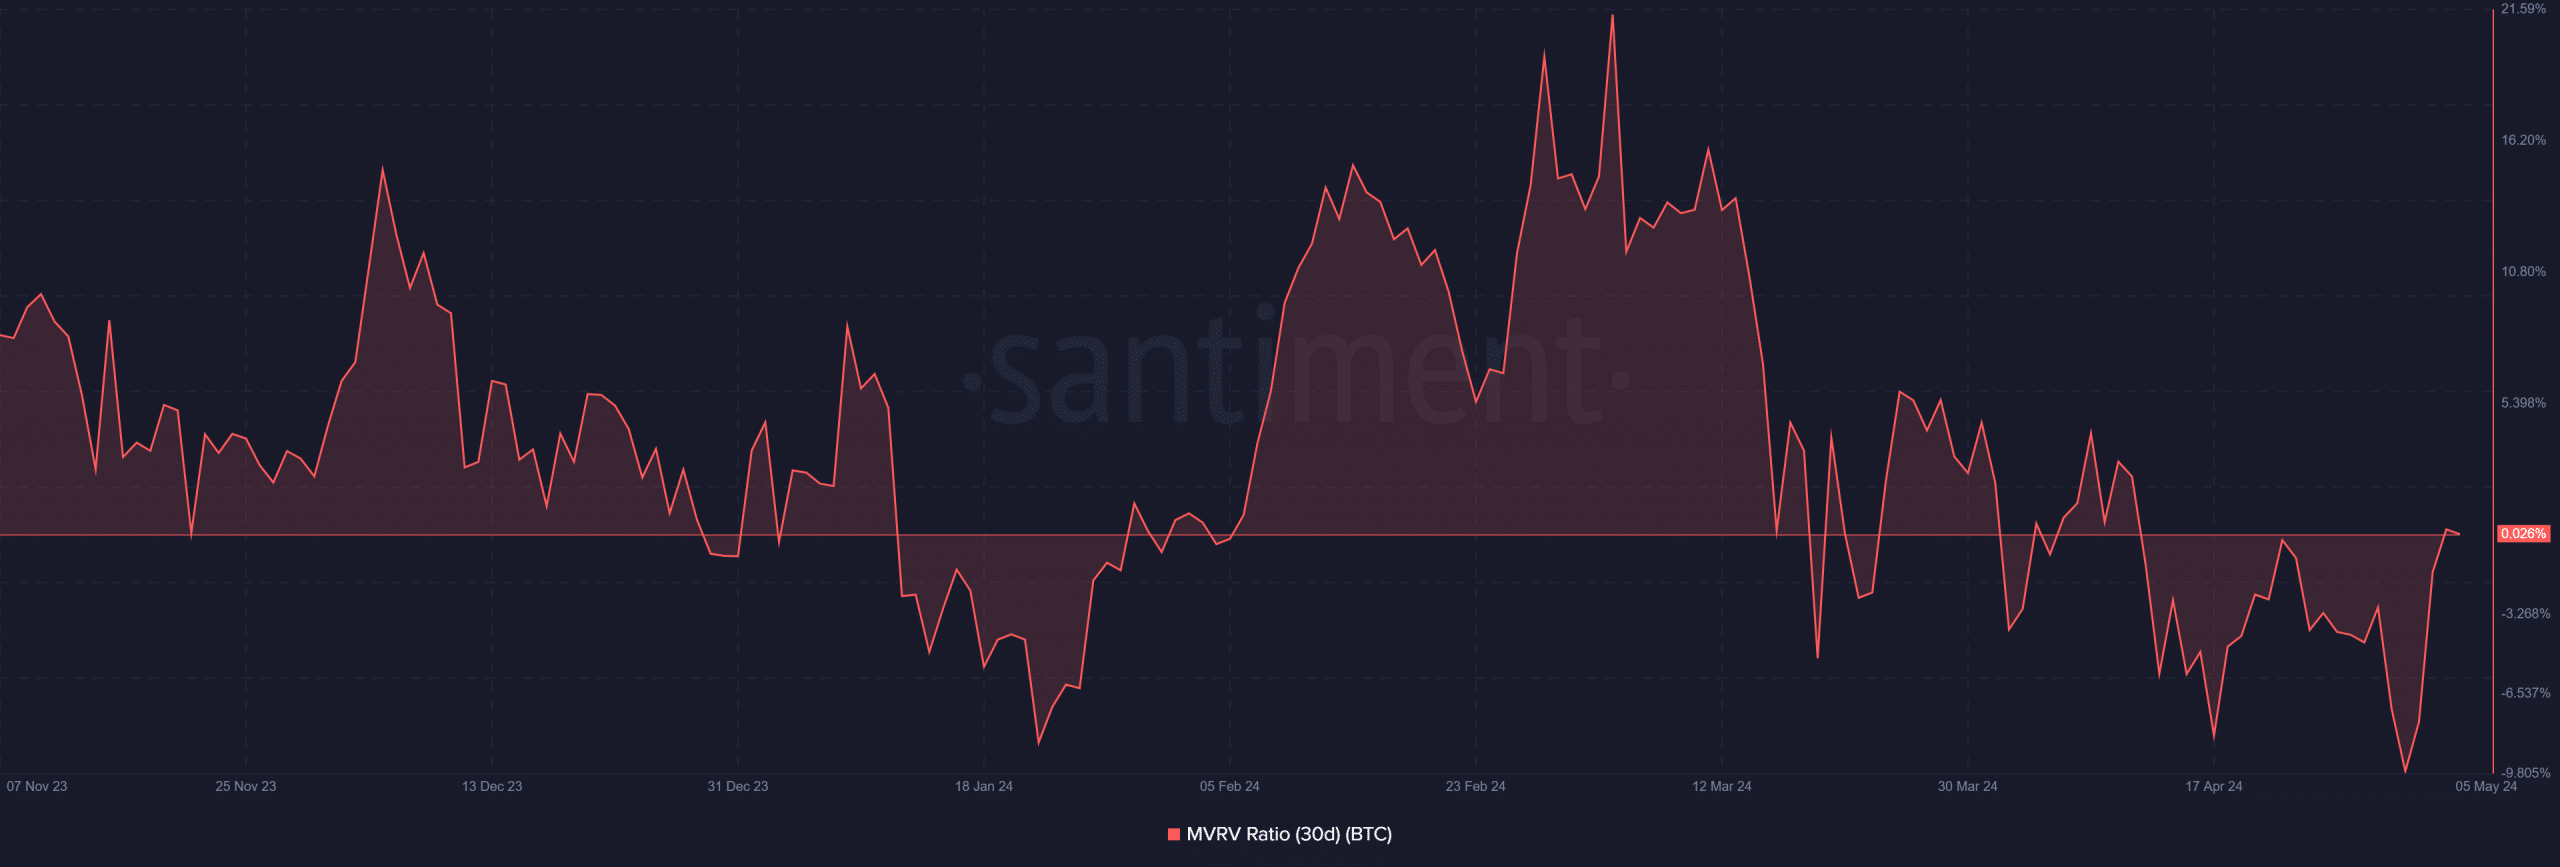
Bitcoin’s 30-day Market Value Realized Value ratio (MVRV) indicated that holders experienced a period of being underwater for much of April.
The chart revealed that BTC remained below zero and reached its lowest point in months, dropping to -9.71%.
Read Bitcoin’s [BTC] Price Prediction 2024-25
However, at the time of this analysis, the MVRV has slightly risen above zero, hovering around 0.026%.
This suggests that holders within this timeframe are profiting, likely due to the recent slight increase in BTC’s price.