Bitcoin Price Analysis: 01 April

Disclaimer: The findings of the following analysis are the sole opinions of the writer and should not be taken as investment advice
Bitcoin, the world’s largest cryptocurrency, broke out past a strong area of resistance in the $56,300-$56,700 zone a couple of days back and rose as far north as $59,680, before being forced to pull back. There were indications that bearish momentum was picking up in the short-term and we could see a dip to $58,000. Such a dip, or even one as far as $56,300, should be treated as a buying opportunity, with a target of $62,000 for BTC in the days to come.
Bitcoin 1-hour chart
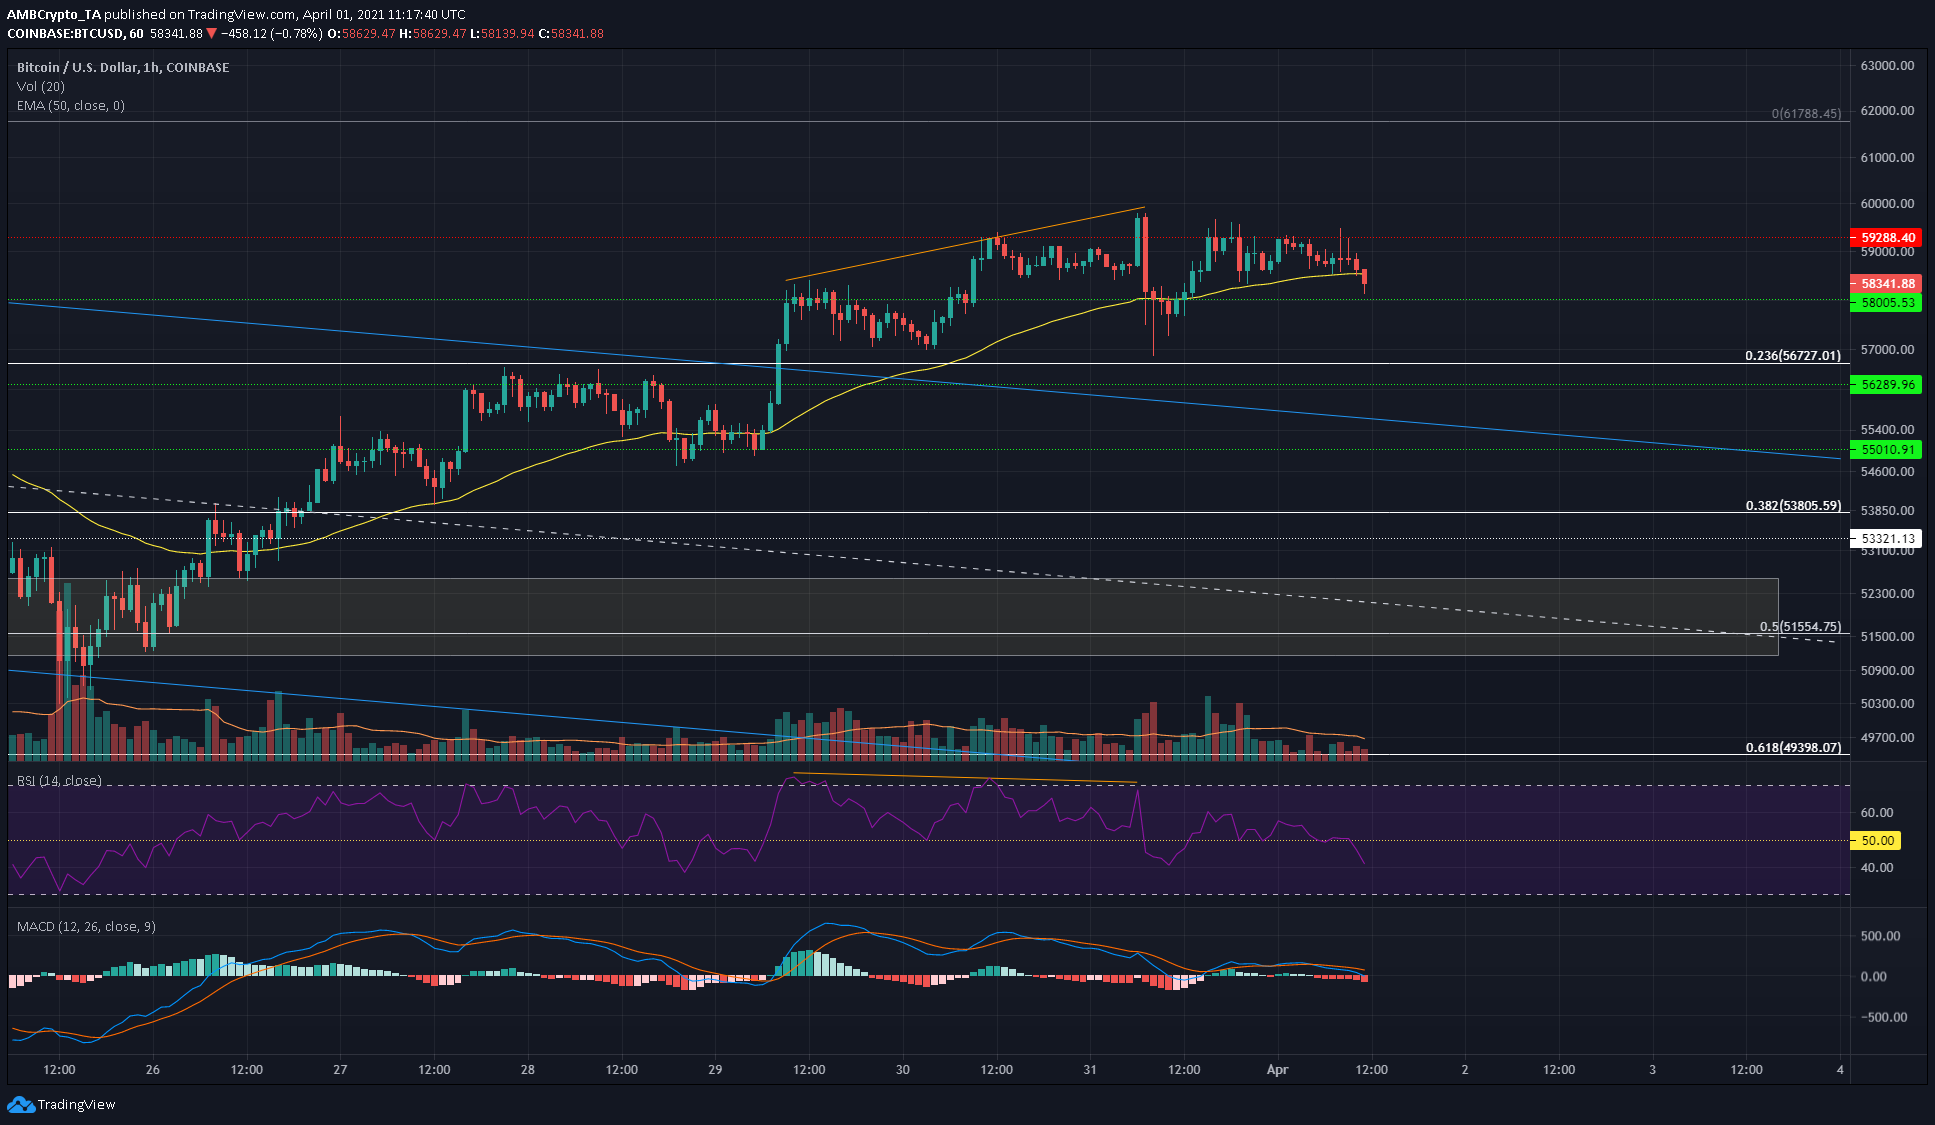
In the attached chart, in blue was the descending channel that BTC broke out of recently. However, after climbing to $58,000 and then to $59,300, BTC pictured a bearish divergence (orange) on the hourly chart.
The aforementioned divergence saw BTC pull back to $58,000. In fact, BTC took only 30 mins to go from $59,200 to $56,800 on that pullback (the long lower candlewick towards $57,000 on this chart), which was bought back quickly. This quick dive could have been triggered by liquidations, before being quickly bought back.
In any case, the price, at press time, was once again heading towards the $57,800-$58,000 area of demand. Further, the crypto’s short-term technical indicators noted rising bearish momentum on the price charts.
Reasoning
The bearish divergence on the hourly has already been highlighted, and this saw BTC reset in the short-term. At the time of writing, BTC was trading at $58,341 and under the 50-period EMA (yellow). A candle close below this moving average would suggest some short-term indecisiveness in the market, one that could see the crypto dip to the support at $58,000.
The RSI was also observed to dip below 50 in light of the rising bearish momentum. The MACD formed a bearish crossover just above the zero line and it could fall below zero to underline the switch in market momentum.
Finally, the trading volume was well below average over the last few hours. This meant that, at least so far, the sellers have not been in control of the market.
Conclusion
While a dip to $56,300 cannot be discounted in the short-term, these would be opportunities to buy the dip because the long-term structure for BTC remains intact, with the crypto projected to head towards $62k-$63k as a target in the days to come.