Bitcoin Price Analysis: 01 May
Disclaimer: The findings of the following analysis are the sole opinions of the writer and should not be taken as investment advice
Bitcoin has recovered by 17.58% since the 26th of April after dropping down to $46,900 on the 25th of the month. Breaching important levels at $51,000 and $56,000 indicated momentum, but the Options expiry on 30 April may have played a role in keeping the price above $54,000 ($3.9 billion contracts expired at 54k).
At the time of writing, BTC was below its immediate short-term resistance of $58,300, with Bitcoin hinting at a bit of correction based on its past performance.
Bitcoin 1-hour chart
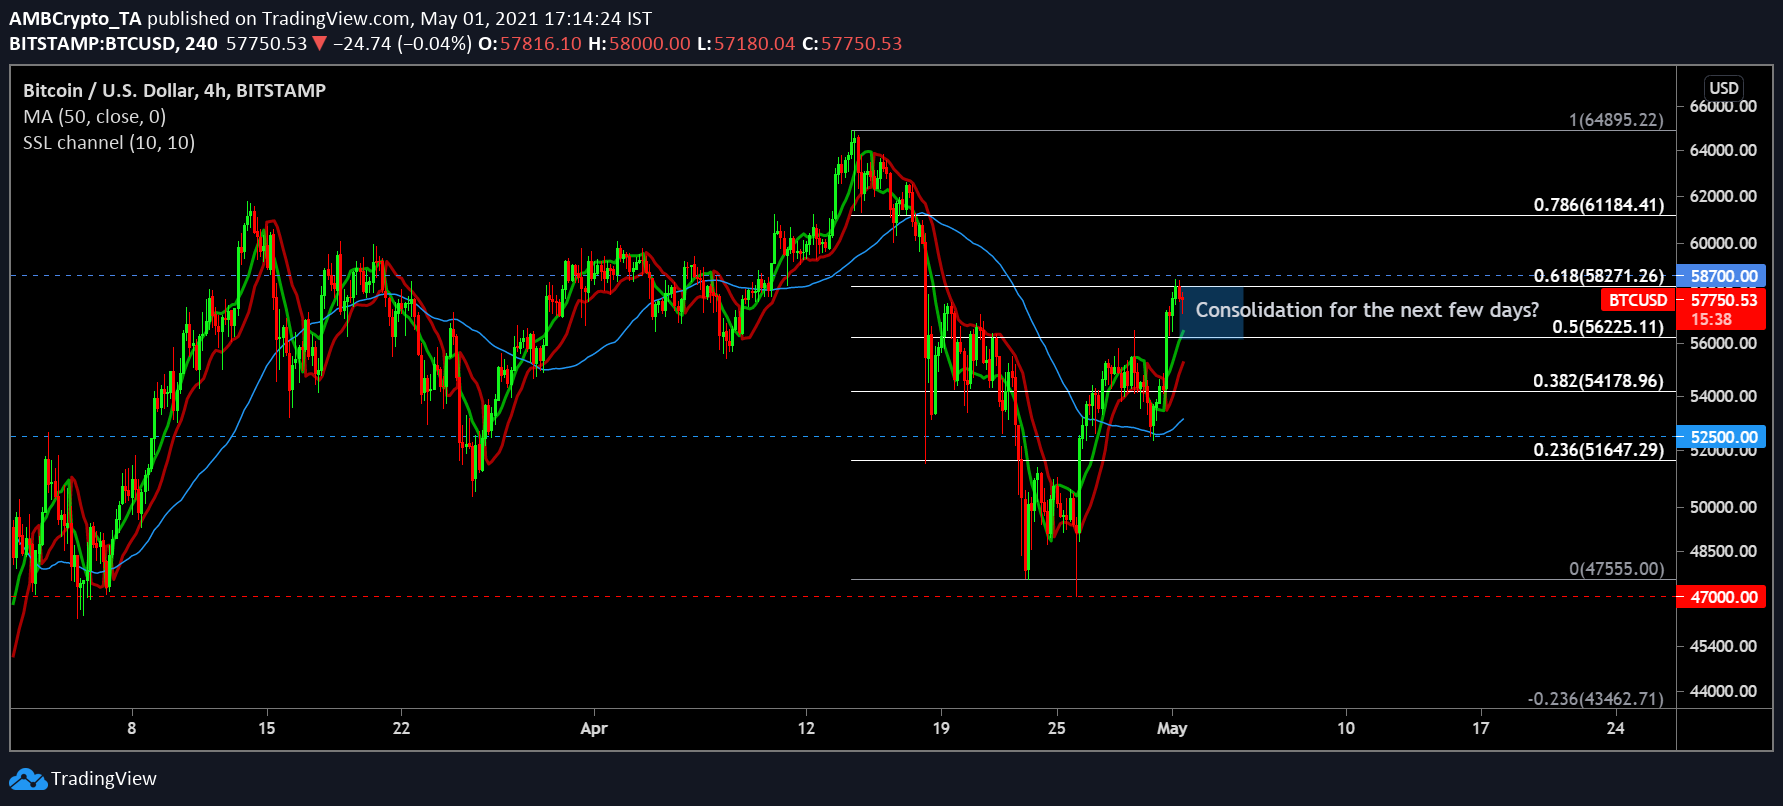
Using the Fibonacci lines, important short-term price ranges were identified. As mentioned earlier, BTC surged past $$51,647, $54,178, and $56,225 on the charts with ease. However, the press time price range may face a stronger resistance level.
With the SSL indicator and the 50-period moving average completely bullish, it is hard to suggest anything other than a price hike, but the likelihood of sideways movement was legitimate as well. Taking a breather over the next few days may allow Bitcoin to bridge the gap to its latest ATH of $65,000, without being overbought in the short term.
Market Rationale
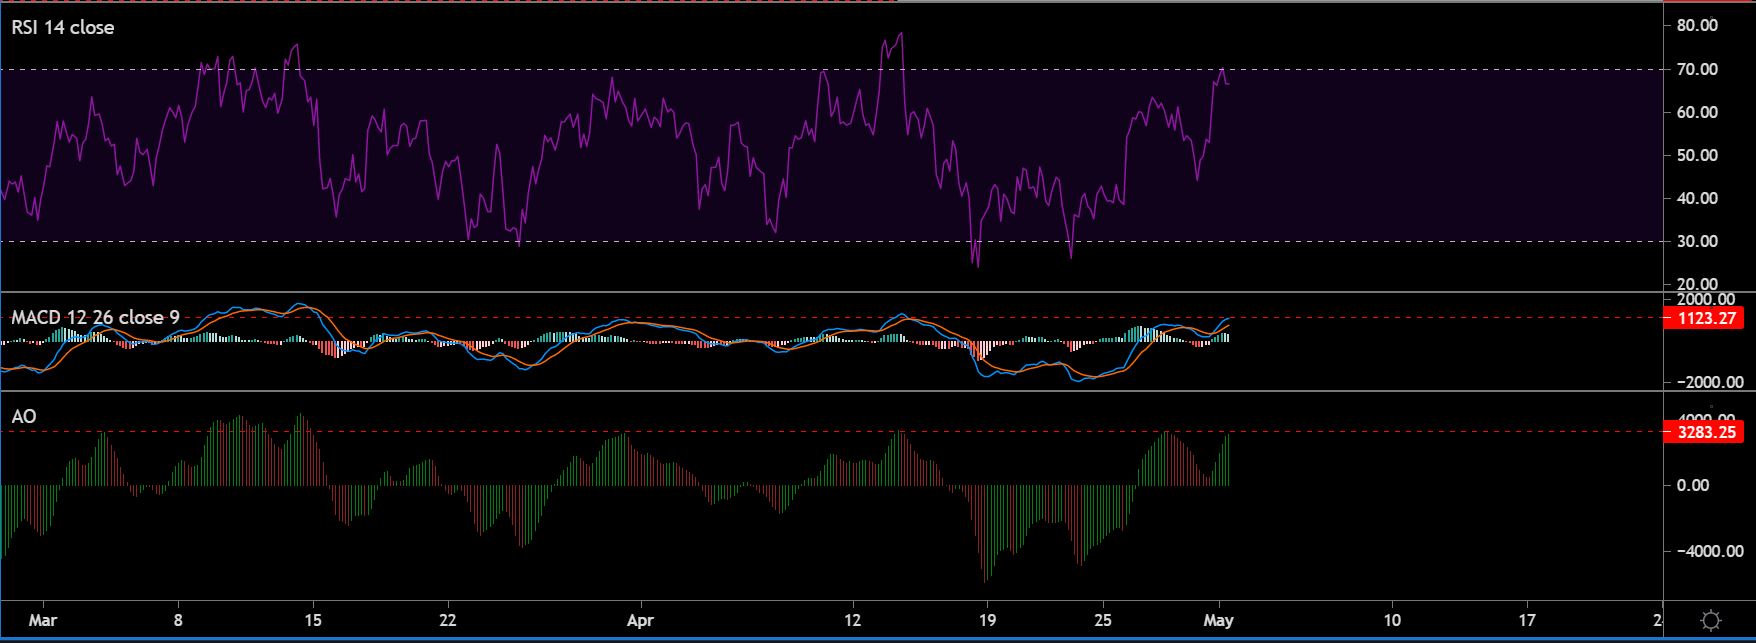
A period of correction or consolidation was solidly observed by the MACD and Awesome Oscillator. Over the past month, the bullish momentum declined from this point, according to the indicator, and a bearish reversal was seen by the MACD signal as well.
The Relative Strength Index or RSI, at press time, was under the overbought zone and this particular range can be held by the traders if the price movement remains sideways and does not see a direct decline. Selling pressure may pull back the RSI a little bit, but buyers will continue to maintain their dominance.
Conclusion
While market structure indicates a period of consolidation or decline, it is important to note that trading with the trend has been critical in 2021. Without taking a breather, it is possible that BTC may also climb above $60,000 within the next 24 hours, but ideally, the price needs to cool down a little before its next leg up on the charts.