Bitcoin Price Analysis: 17 April

Bitcoin dropped from $63,000 to $60,500 following the news that Turkey’s central bank had imposed a ban on crypto-holders using their digital assets for payments. Funding rates for BTC hovered just above +0.05%, showing that the buying side has not been overcrowded for some time now. Despite the news that sparked a small sell-off (the price drop amounted to 3%), Bitcoin still held strong above the $60,000 mark.
Bitcoin 1-hour chart
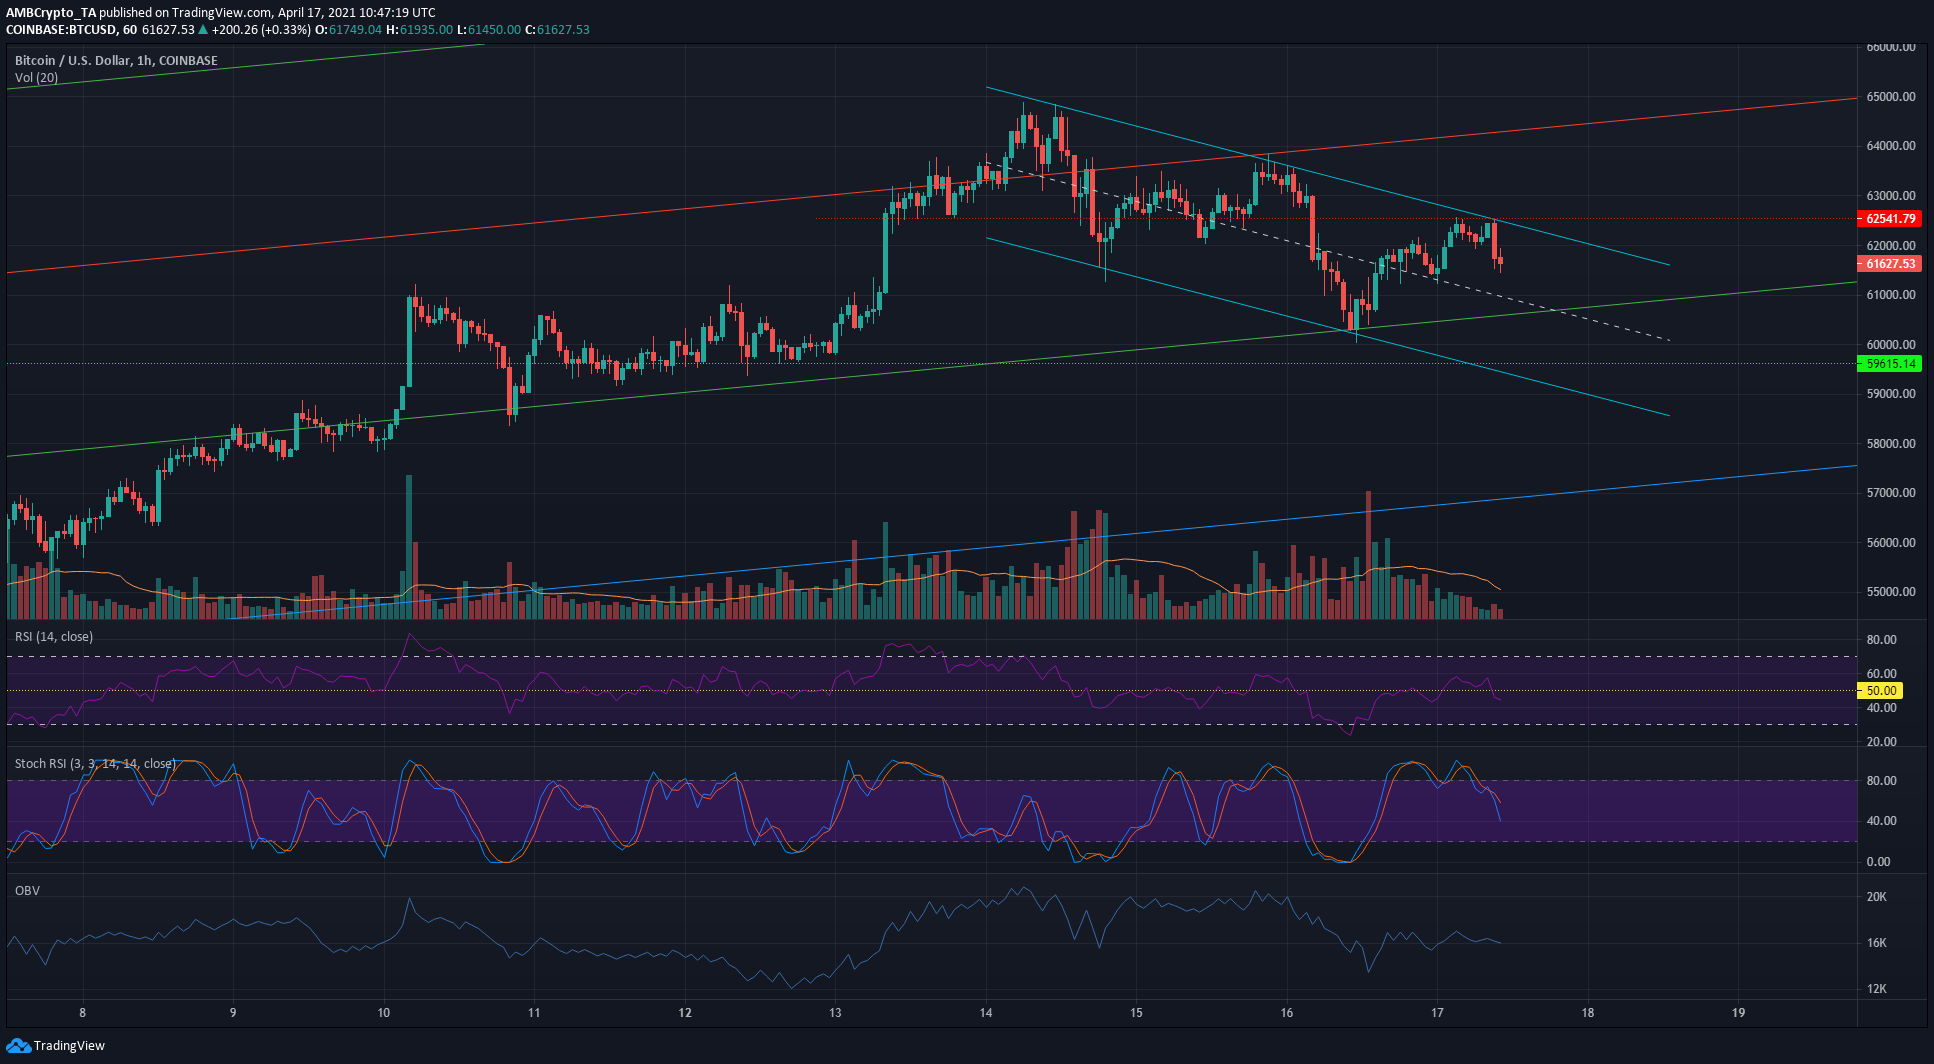
Going forward, $60,7500 and $58,000 are likely to be strong levels of support for BTC. The price recently tested the $60k mark but saw a bounce to $62,541 but was likely headed back toward the $60,800 area once more.
On the charts, a pitchfork and a descending channel, alongside horizontal support levels, were used to plot areas of demand and supply for BTC. The descending channel (cyan) has been in play since the 14th. Over the next few hours, the confluence between the mid-point of the channel and the lower boundary (green) of a trend channel from the pitchfork could act as strong support for BTC in the $60,7500 area. A drop beneath this level will see BTC test $59,600 or as low as $58,900.
Rationale
The lines plotted show that BTC bulls would need to defend key areas of support over the weekend. Dropping beneath the $59.500-$58,900 area could see BTC plummet further toward $56,000. A resolute defense of the $60,750 is a necessary development to halt further losses for BTC.
The RSI dropped beneath neutral 50, while the Stochastic RSI also took a dive. This highlighted that the recent bounce for BTC off the $60,000 mark was at an end, and some more losses could be in store.
The OBV has been trending downward since the $64,600 highs a few days ago. The seller bias in the market needs to swing before BTC can break past $62,000 once more.
Conclusion
While the short-term outlook has a bearish tinge, a drop to $58,900 will likely be a buying opportunity for BTC, and a move past the channel’s upper boundaries will also be a signal of a move to $64,000.