Bitcoin Price Analysis: Bears continues stagnation and bears and bulls reach an impasse

Bitcoin was priced at $11,692 at press time. According to CoinMarketCap, BTC had a market cap of around $208 billion.
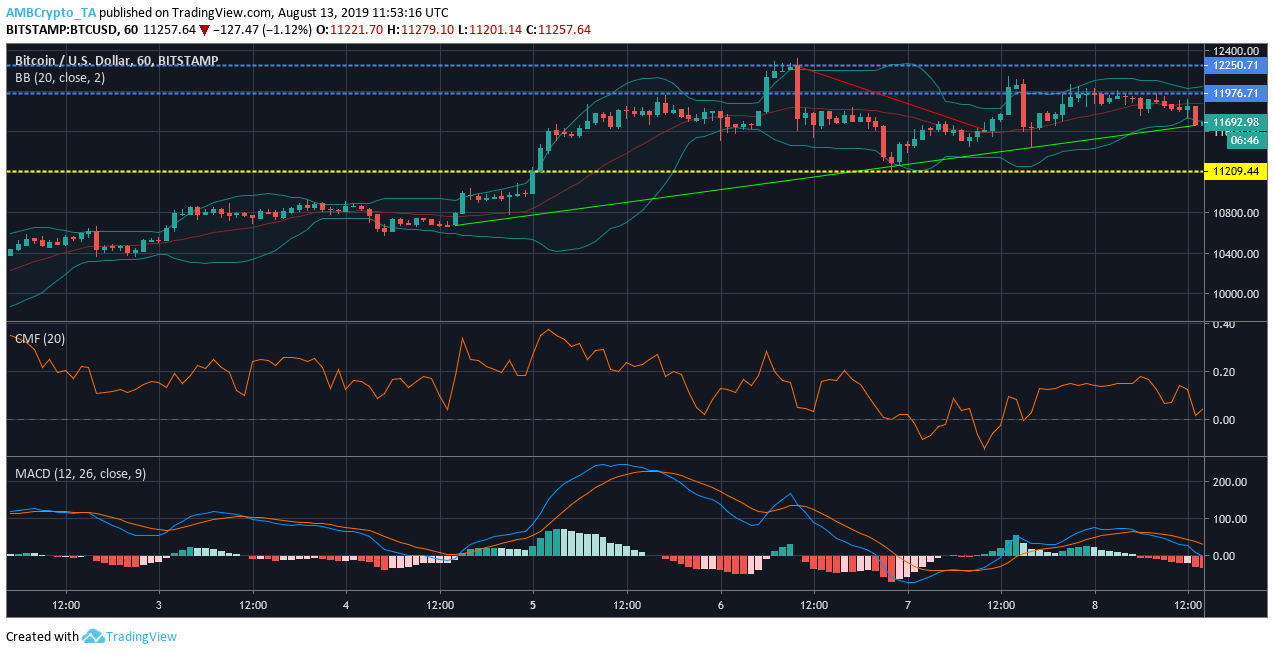
1 Hour chart

Source: Trading View
Bitcoin confronted resistance at $11,976 and $12250. It formed support at $11,209.44. BTC recorded a downtrend from $12,249 and $11,615. BTC’s uptrend started at $10,0667 and extended up to $11,692.9.
Bollinger Band indicated fluctuations in the volatility.
Chaikin Money Flow showed that the marker is above the zero lines, suggesting that the money flowing in is higher than the money flowing out of the market.
MACD is seen having a bearish crossover as the MACD line is hovering below the signal line.
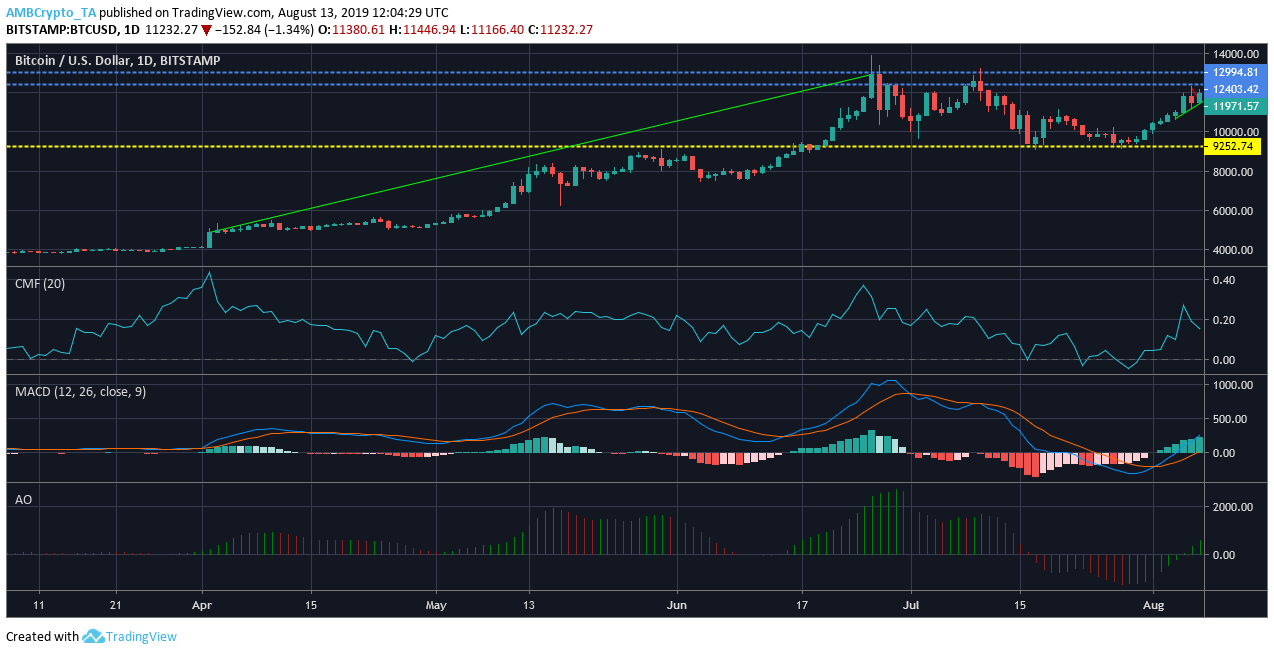
1 Day BTC Chart

Source: Trading View
BTC found resistance at $12,403.42 and $12,994.4 and the support was placed at $9252.74. BTC saw a longterm uptrend that extended from $4277.52 to $12889.42.
Chaikin Money Flow indicated that the money flowing into the market is higher than the money flowing out.
MACD presented a bullish crossover, where the MACD line is seen crossing over the signal line.
Awesome Oscillator indicated a bullish momentum in the market.
Conclusion
BTC is seen pointing towards a neutral trend as short term indicators and long term indicators.


