Bitcoin surges into a former support zone, should you expect a breakout

- The bearish BTC daily structure remained unbroken but the lower timeframes showed strong bullishness
- A strong rejection could fuel selling pressure but consolidation beneath $22.6k would likely point toward further gains
The volatility returned just before the opening of the Asia markets. Bitcoin posted rapid gains and appeared to violently invalidate the idea that the market would continue to descend.
However, from a technical perspective, there remained a chance that BTC could resume the previous slump after the gains of the past few hours.
Read Bitcoin’s [BTC] Price Prediction 2023-24
$212 million were liquidated in the past 24 hours and 83.5% of them were short positions, according to Coinglass data.
The return of BTC to a former trendline resistance offered an ideal opportunity to short the king of crypto once more- but will this be a successful trade?
Bitcoin pumps right past a critical level of resistance
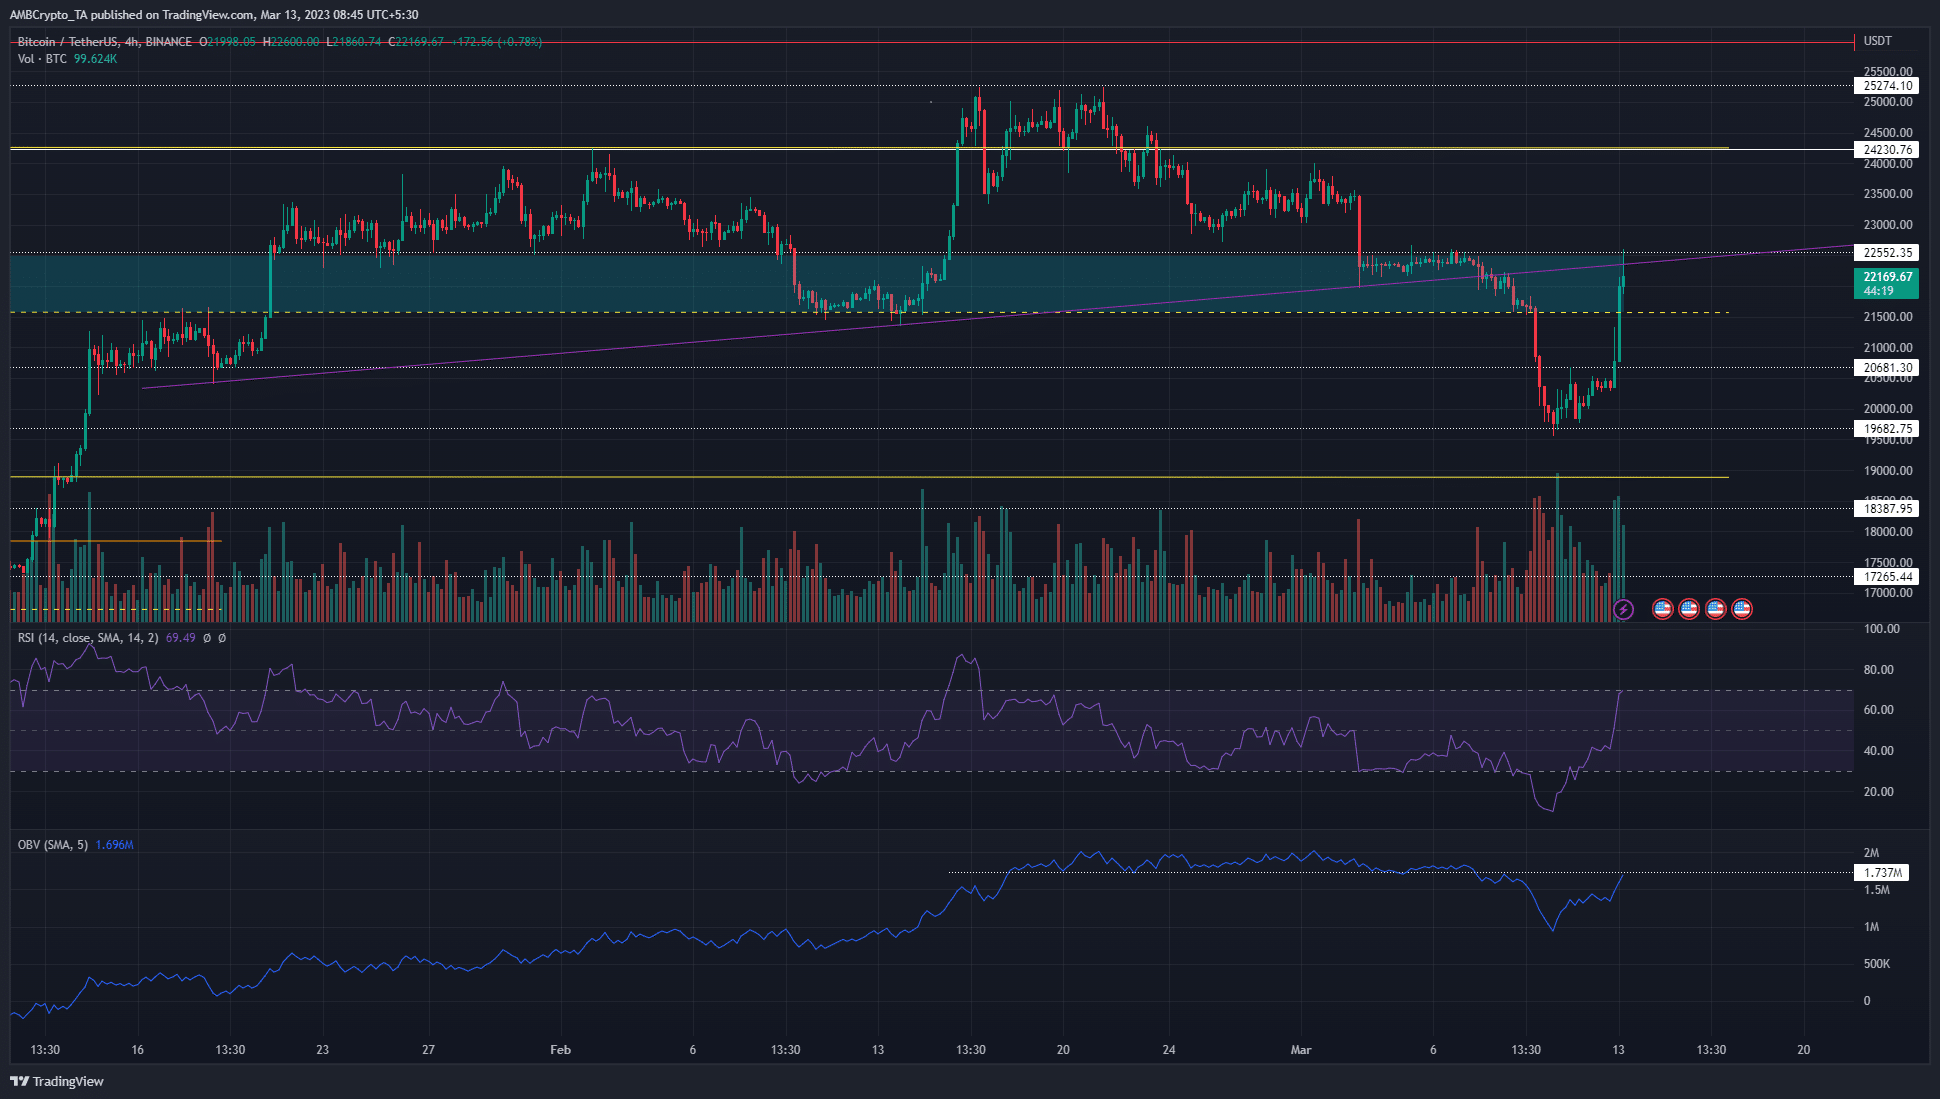
The $21.6k mark served as an important level of support on 10 February and the rally to $25.2k continued after a retest of this level. Over the past week, the price fell rapidly beneath the $22.2k lower timeframe support and crashed straight past the $21.6k support as selling pressure intensified.
The weekend saw Bitcoin settle around the $20k mark after a 4-hour candlewick down to $19.5k. Buyers stepped in as the markets began to open in Asia, and the prices saw a massive rally. The move from $20.3k to $22.5k measured 11%, but the price was yet to break the bearish structure on the daily chart.
As for the H4 structure itself, it was debatable. More aggressive approaches would count the move above $20.6k as a structural shift. On the other hand, a more conservative approach would be to wait for a session close above $22.6k.
Is your portfolio green? Check the Bitcoin Profit Calculator
The lower high at $22.6k formed early in March and developed over four days, while the $20.6k one occurred over a weekend. Hence, Bitcoin buyers had grounds to remain cautious despite the swift gains in recent hours.
Late longs could get punished, and FOMO must be avoided. BTC stood at a good risk-to-reward area to short the coin. This upward move could have been a liquidity hunt before a steady bleed over the next week or two.
Meanwhile, an H4 session close above $22.6k would invalidate the bearish idea.
The futures market showed sentiment shifted to bullish
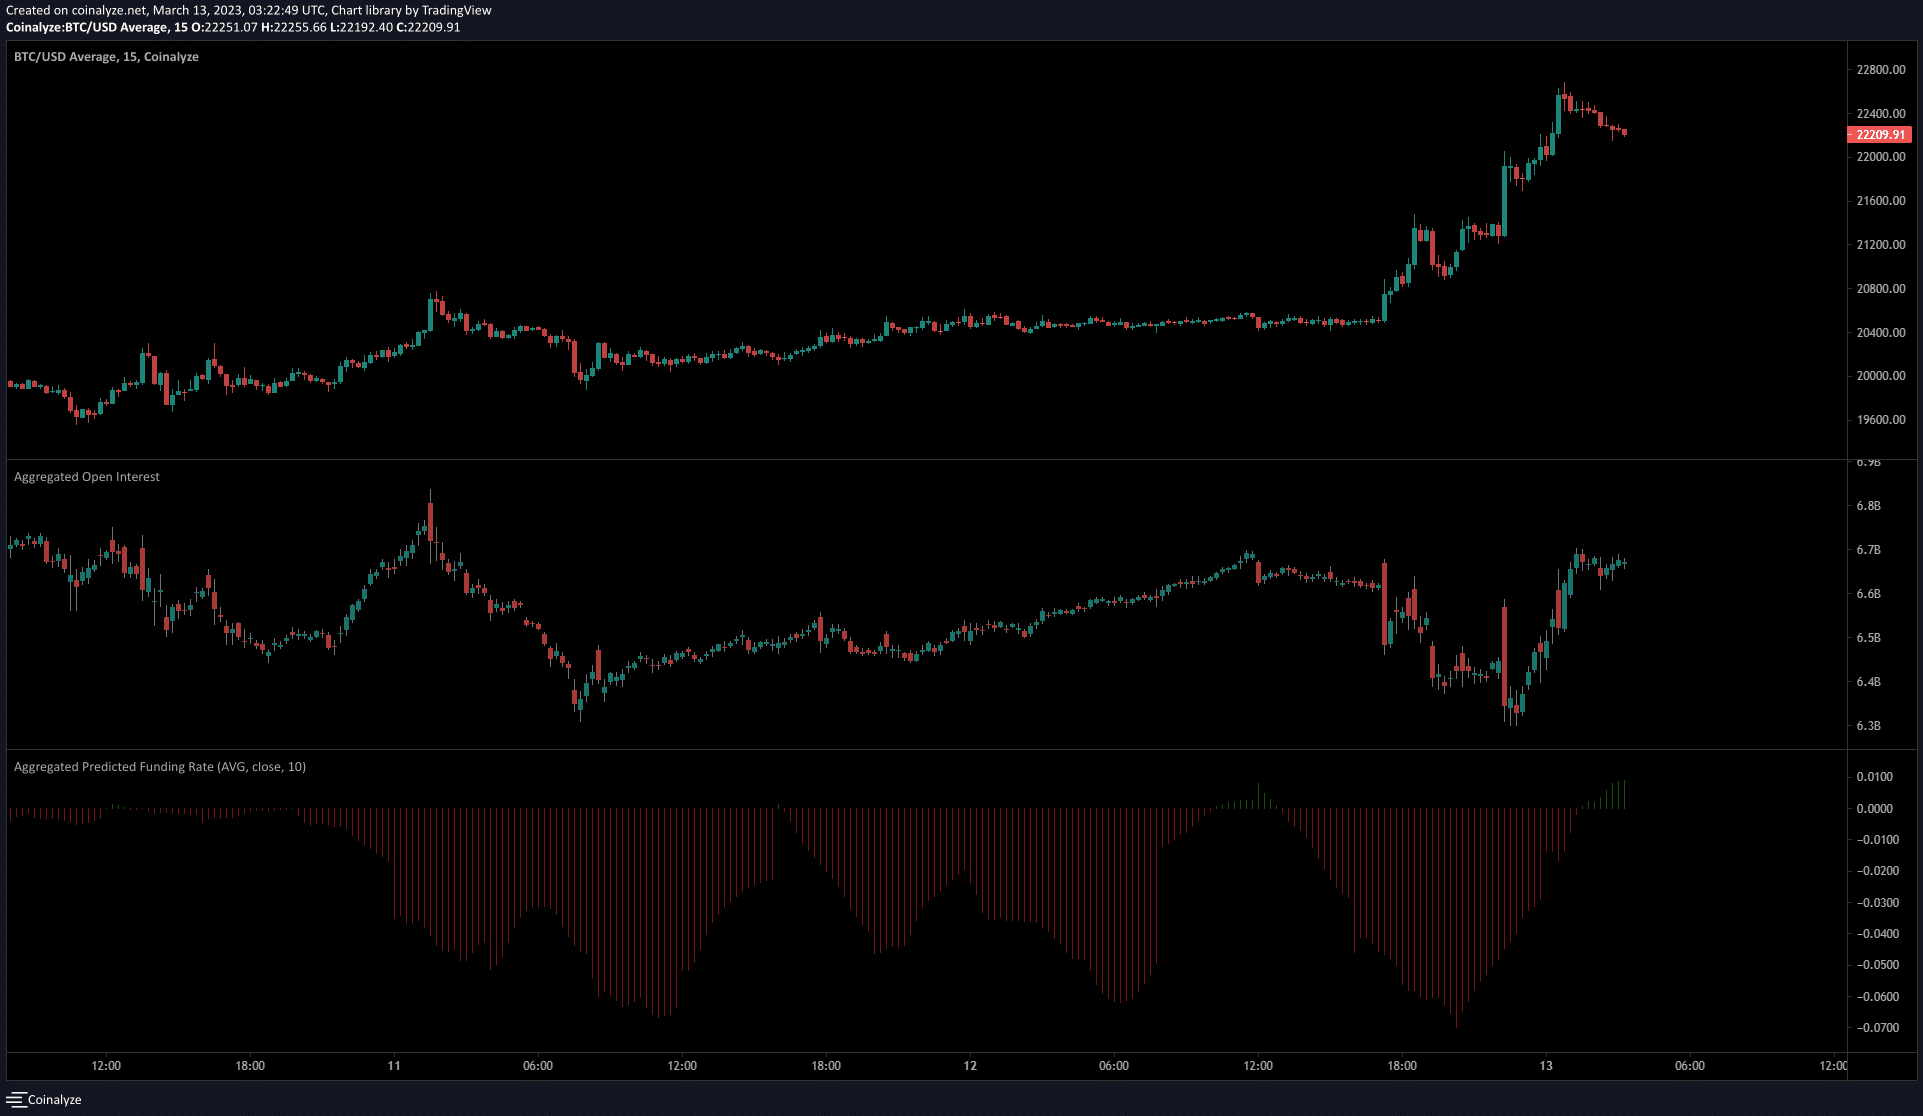
The 15-minute chart showed that the late hours of Sunday saw a high negative funding rate to show short positions crowded the market.
When the price shot past resistance levels and forced these positions to close, it induced strong buying pressure. Hence, initially, we see a fall in the Open Interest to show bearish sentiment. This shifted after the BTC move above $21.2k.
Thereafter, both the OI and the prices began to advance rapidly. The funding rate also began to shift and at press time was positive once more. Together, they showed bullishness on the lower timeframes.


