Bitcoin SV, IOTA, Nano Price Analysis: 13 December

Bitcoin SV recovered somewhat following the gains Bitcoin posted over the past couple of days, with BSV approaching its level of resistance on the charts. IOTA was trading just above its level of support, and a rise past $0.3 signaled that a test of $0.326 was imminent. Nano gave a bullish signal and posted some gains over the past 32 hours.
Bitcoin SV [BSV]
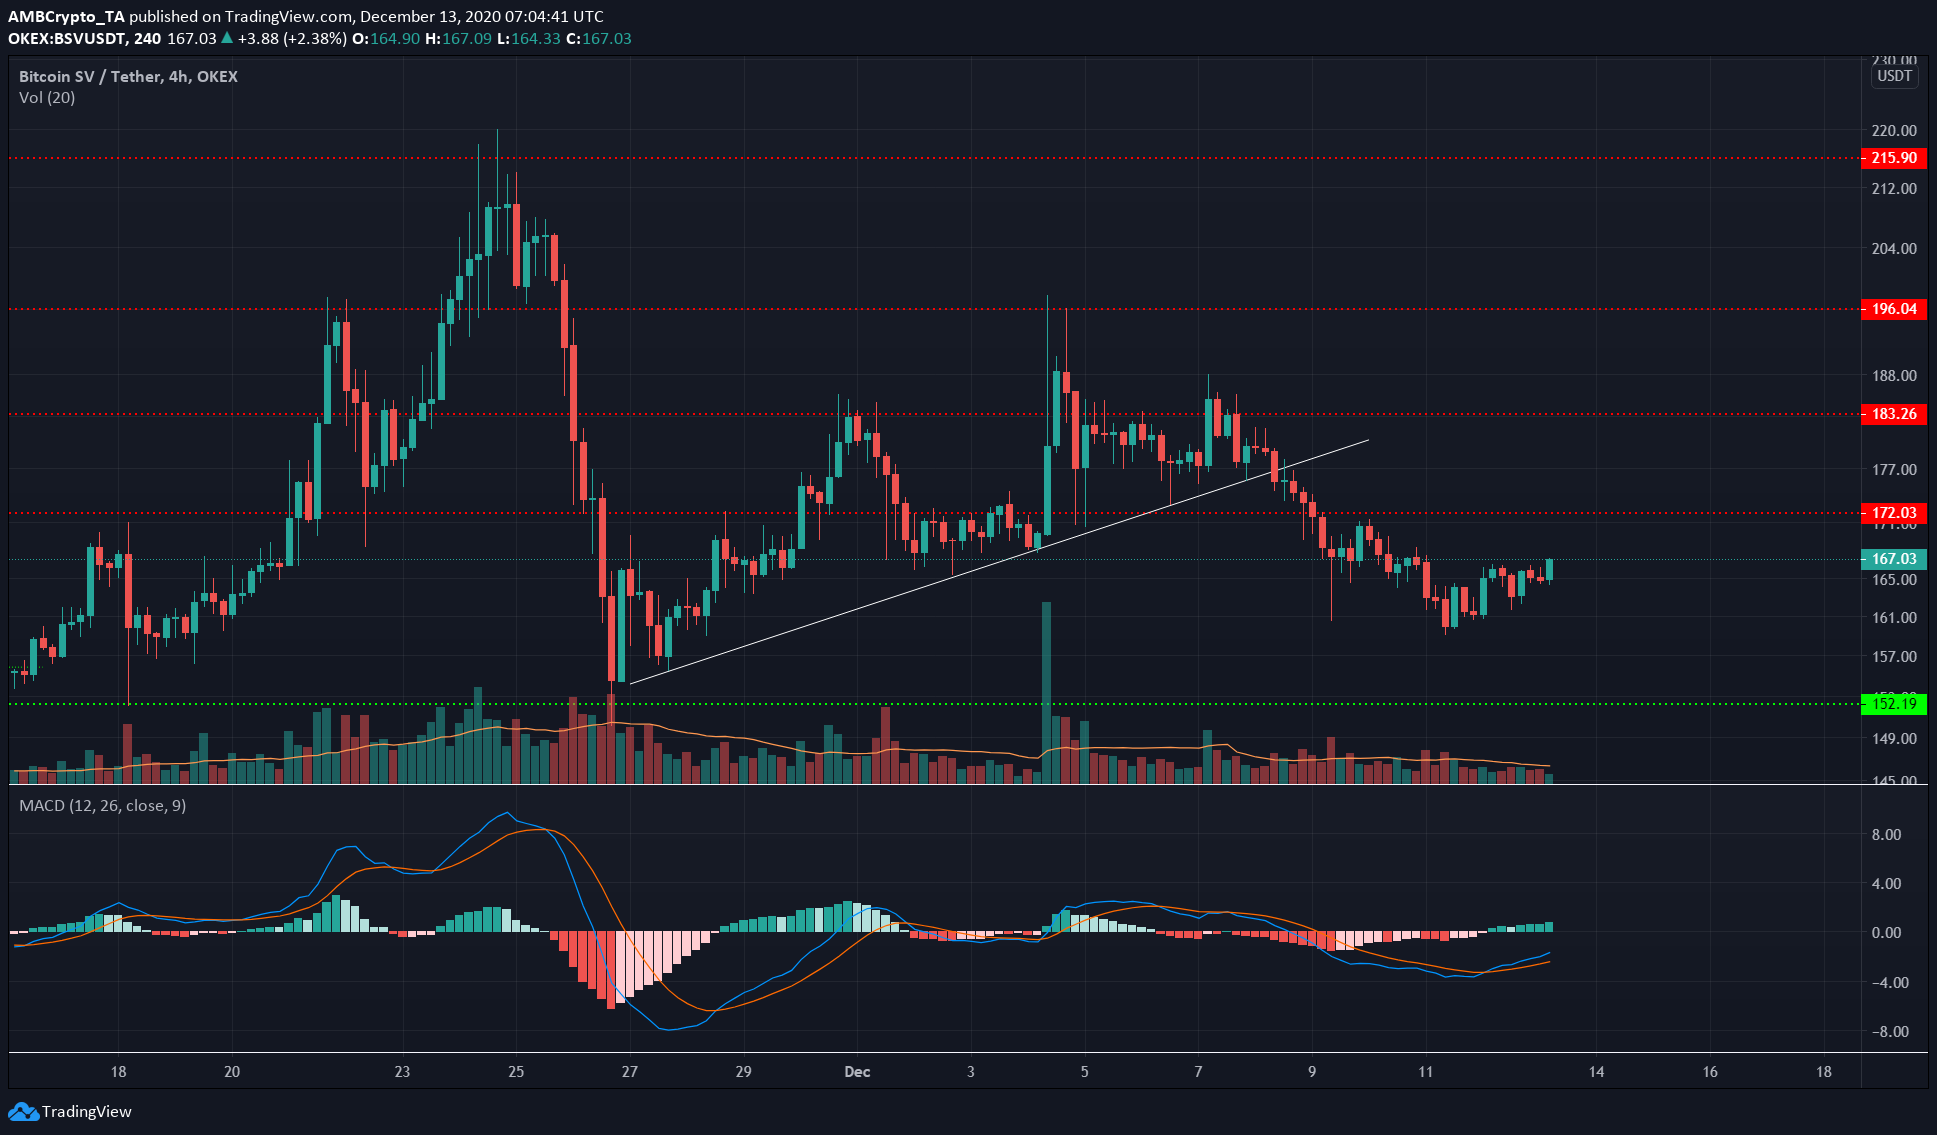
BSV recovered alongside BTC over the past couple of days, but the gains were not equal. BSV gained by 4.5% while BTC gained by nearly 9% in the same period of time.
In response, the MACD formed a bullish crossover to generate a weak buy signal. However, a level of resistance at $172 loomed for BSV.
The region at $168 can act as a region of supply and stall BSV’s advances north. Flipping the level to support would pave the way for BSV to recover recent losses and rise to test $183 once more.
IOTA
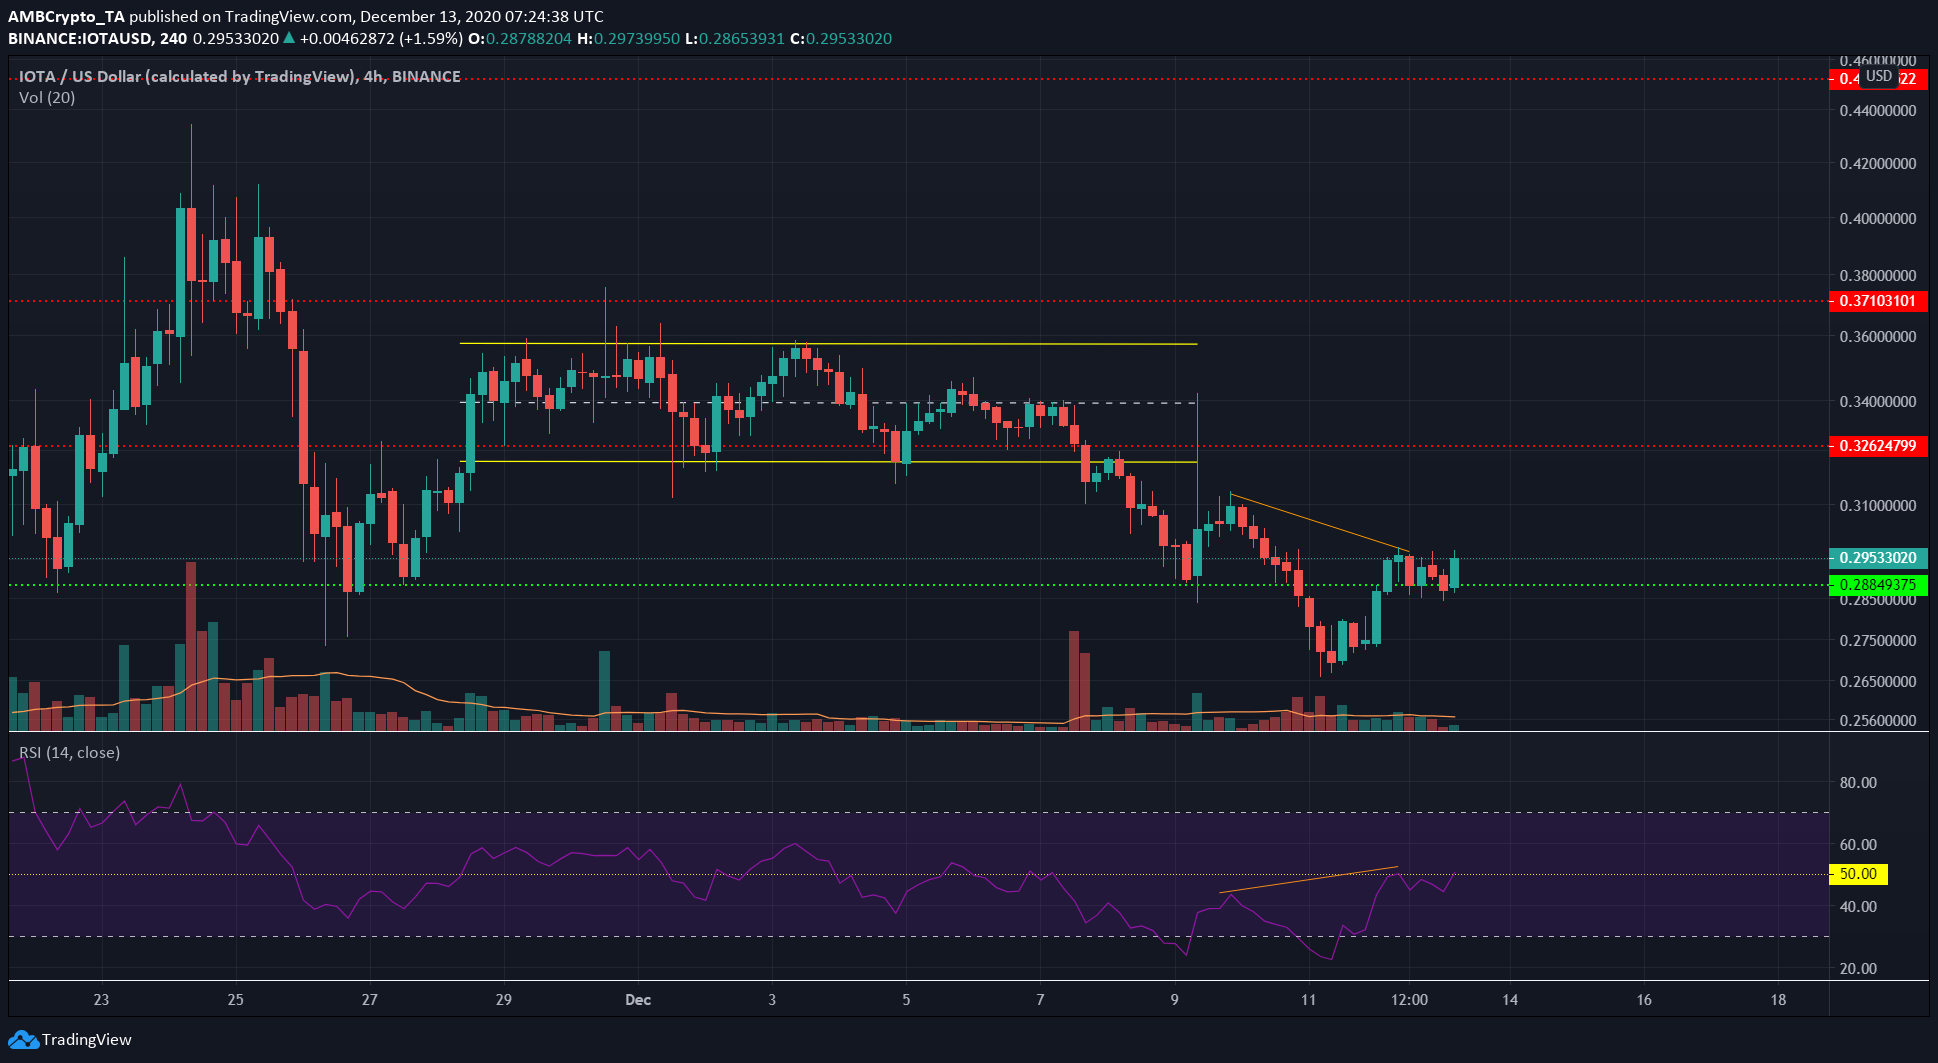
IOTA showed a hidden bearish divergence between the price and its momentum, with the crypto registering a minor dip from $0.296 to $0.287.
While it usually signals the continuation of a previous trend, the price refused to drop past its support. The RSI had not yet risen past the neutral 50-line, and there seemed to be two scenarios that could play out.
The bullish one would be an RSI rise past 50, retest, and further rise accompanied by an IOTA move to test the resistance at $0.326. A bearish scenario would be if IOTA loses the $0.288-support in the coming hours and the RSI fails to rise past 50, indicating a continued downtrend.
Nano [NANO]
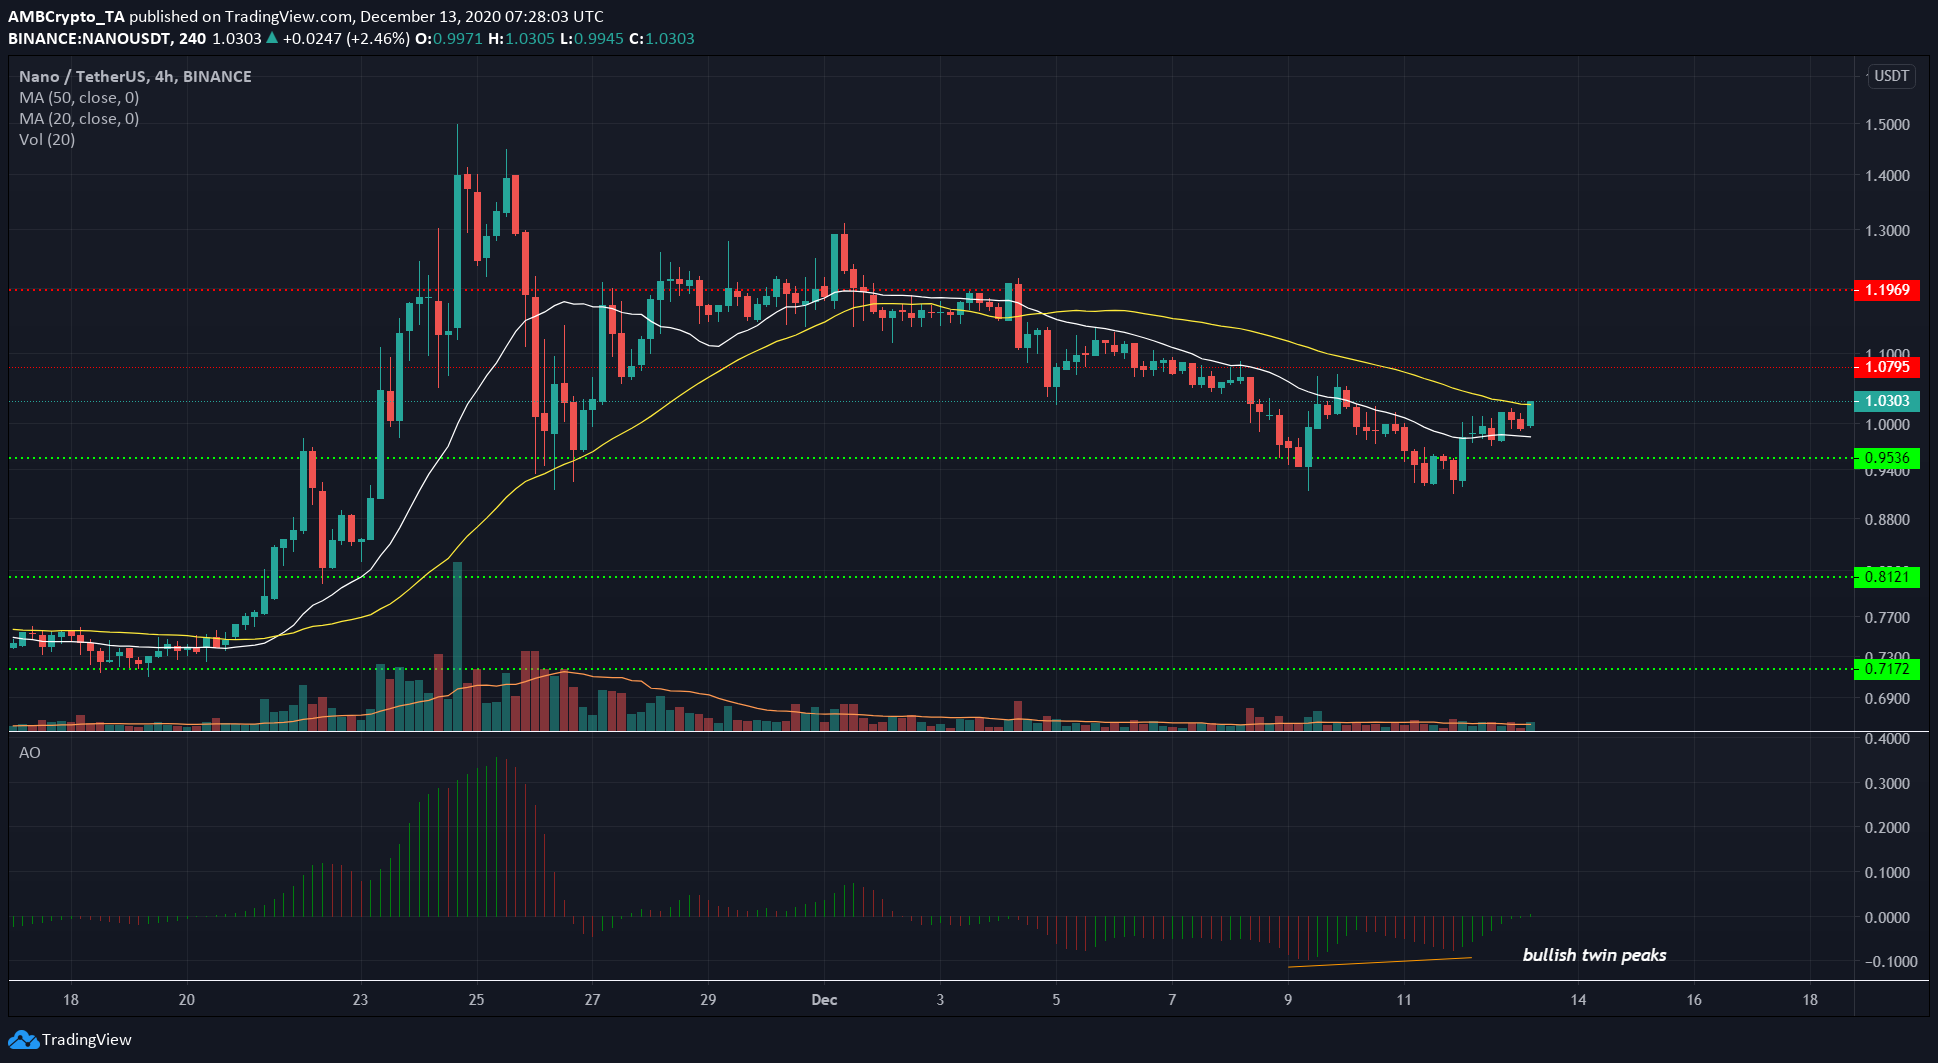
The Awesome Oscillator highlighted a bullish twin peak set up formed for NANO when the price was just under its level of support at $0.95.
Subsequently, the price surged past its level of resistance and was trading at $1.07.
It also rose past the 20 SMA (white), a level that had acted as resistance over the past week. At the time of writing, the price was trading above the 50 SMA as well, and a session close above this moving average would confirm the short-term bullish momentum for Nano.
This could see it rise to test the level of resistance at $1.19.