Bitcoin SV, Waves, Dogecoin Price Analysis: 01 April

Bitcoin SV attempted to climb past the $218-level of resistance once more, with the same noting demand from buyers on its rally from $185. On the contrary, Dogecoin and Waves’s charts suggested that some bearish sentiments could set in over the next few days.
Bitcoin SV [BSV]
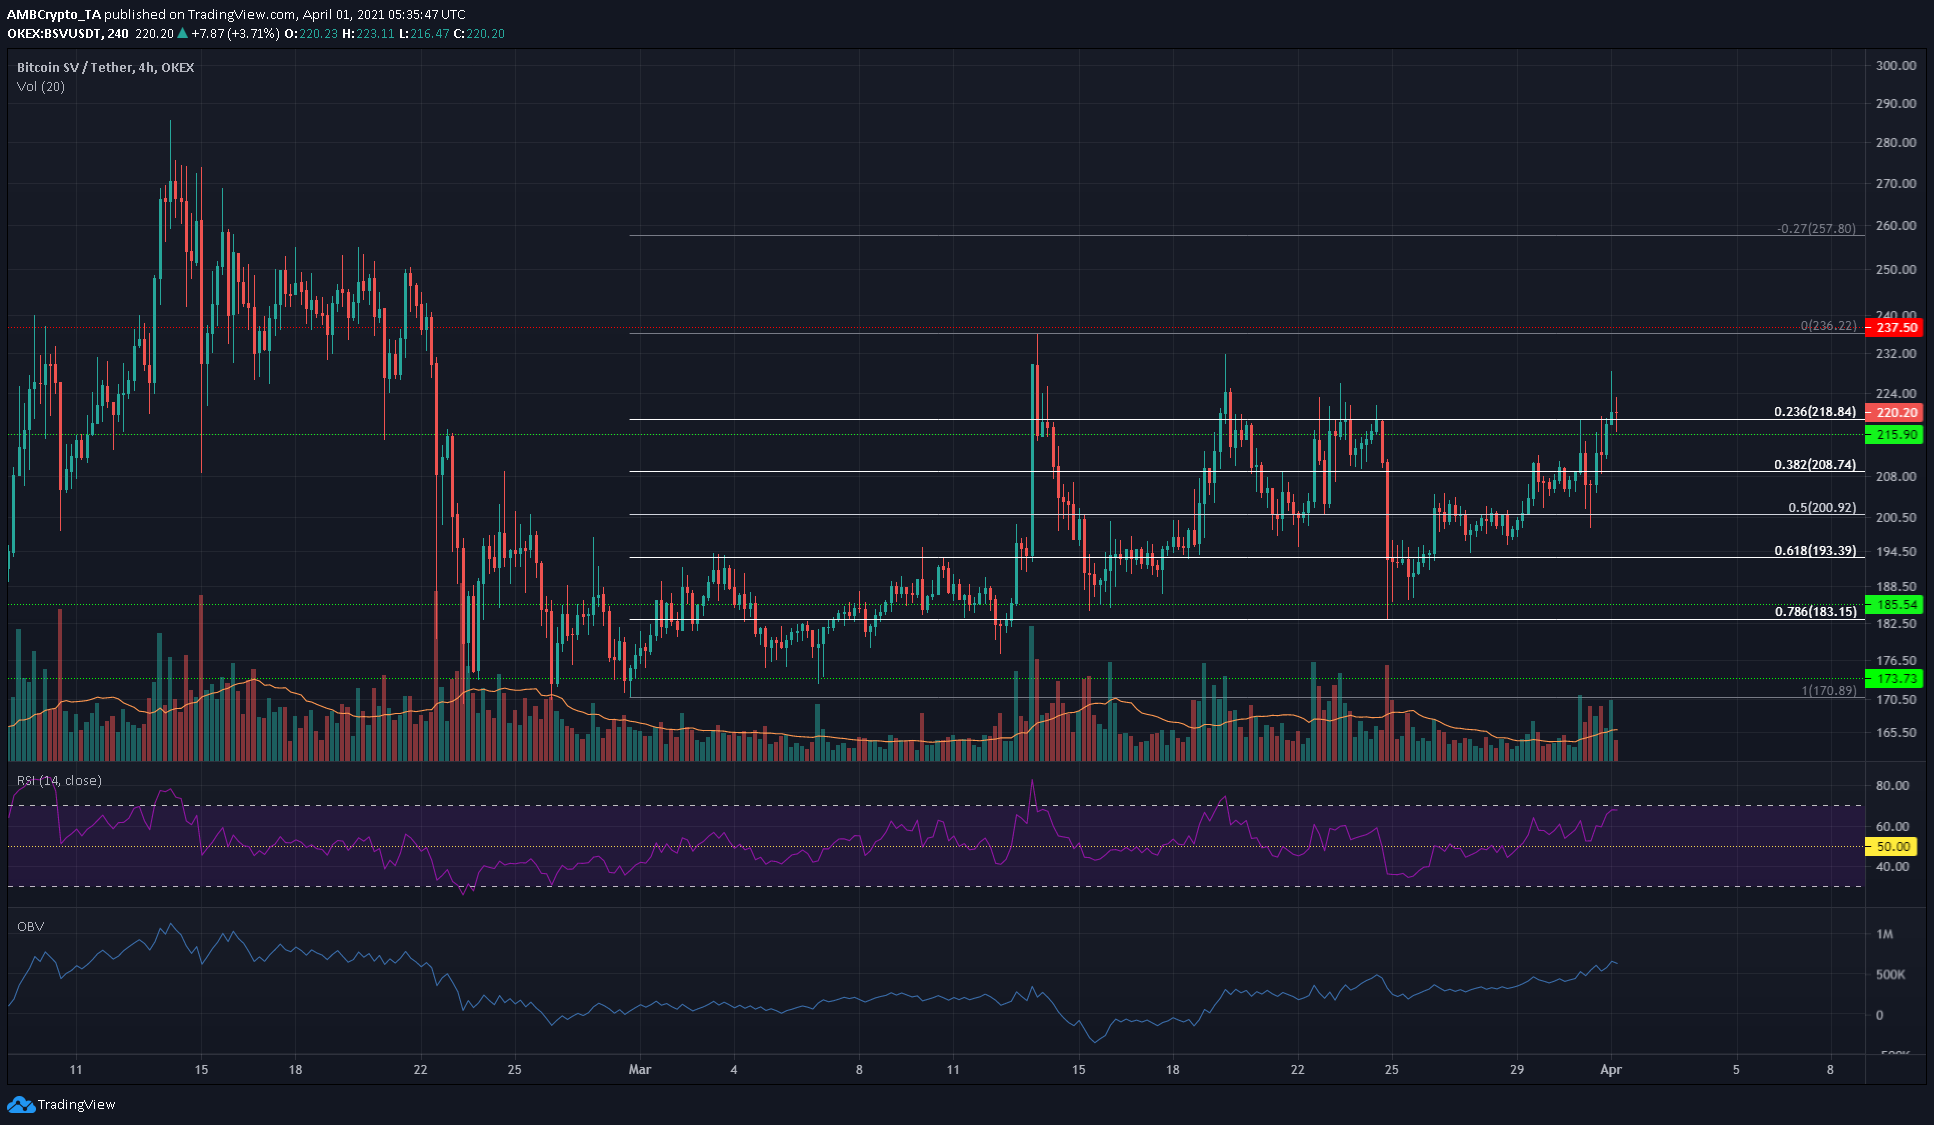
The $218-level of resistance has been one that has stubbornly resisted BSV’s attempts to climb north over the past three weeks. However, its most recent attempt could yield some positive results.
The OBV was on a steady uptrend since the previous rejection at this resistance, indicating that, unlike its preceding attempts, this rally had significant demand driving it higher. The RSI noted a value of 67, at the time of writing.
The $208-$218 zone can be used to fill some buy orders, with a conservative stop-loss under $200. The $237 and $257 levels will be take-profit levels for BSV in a move that could take a few days to materialize.
Waves [WAVES]
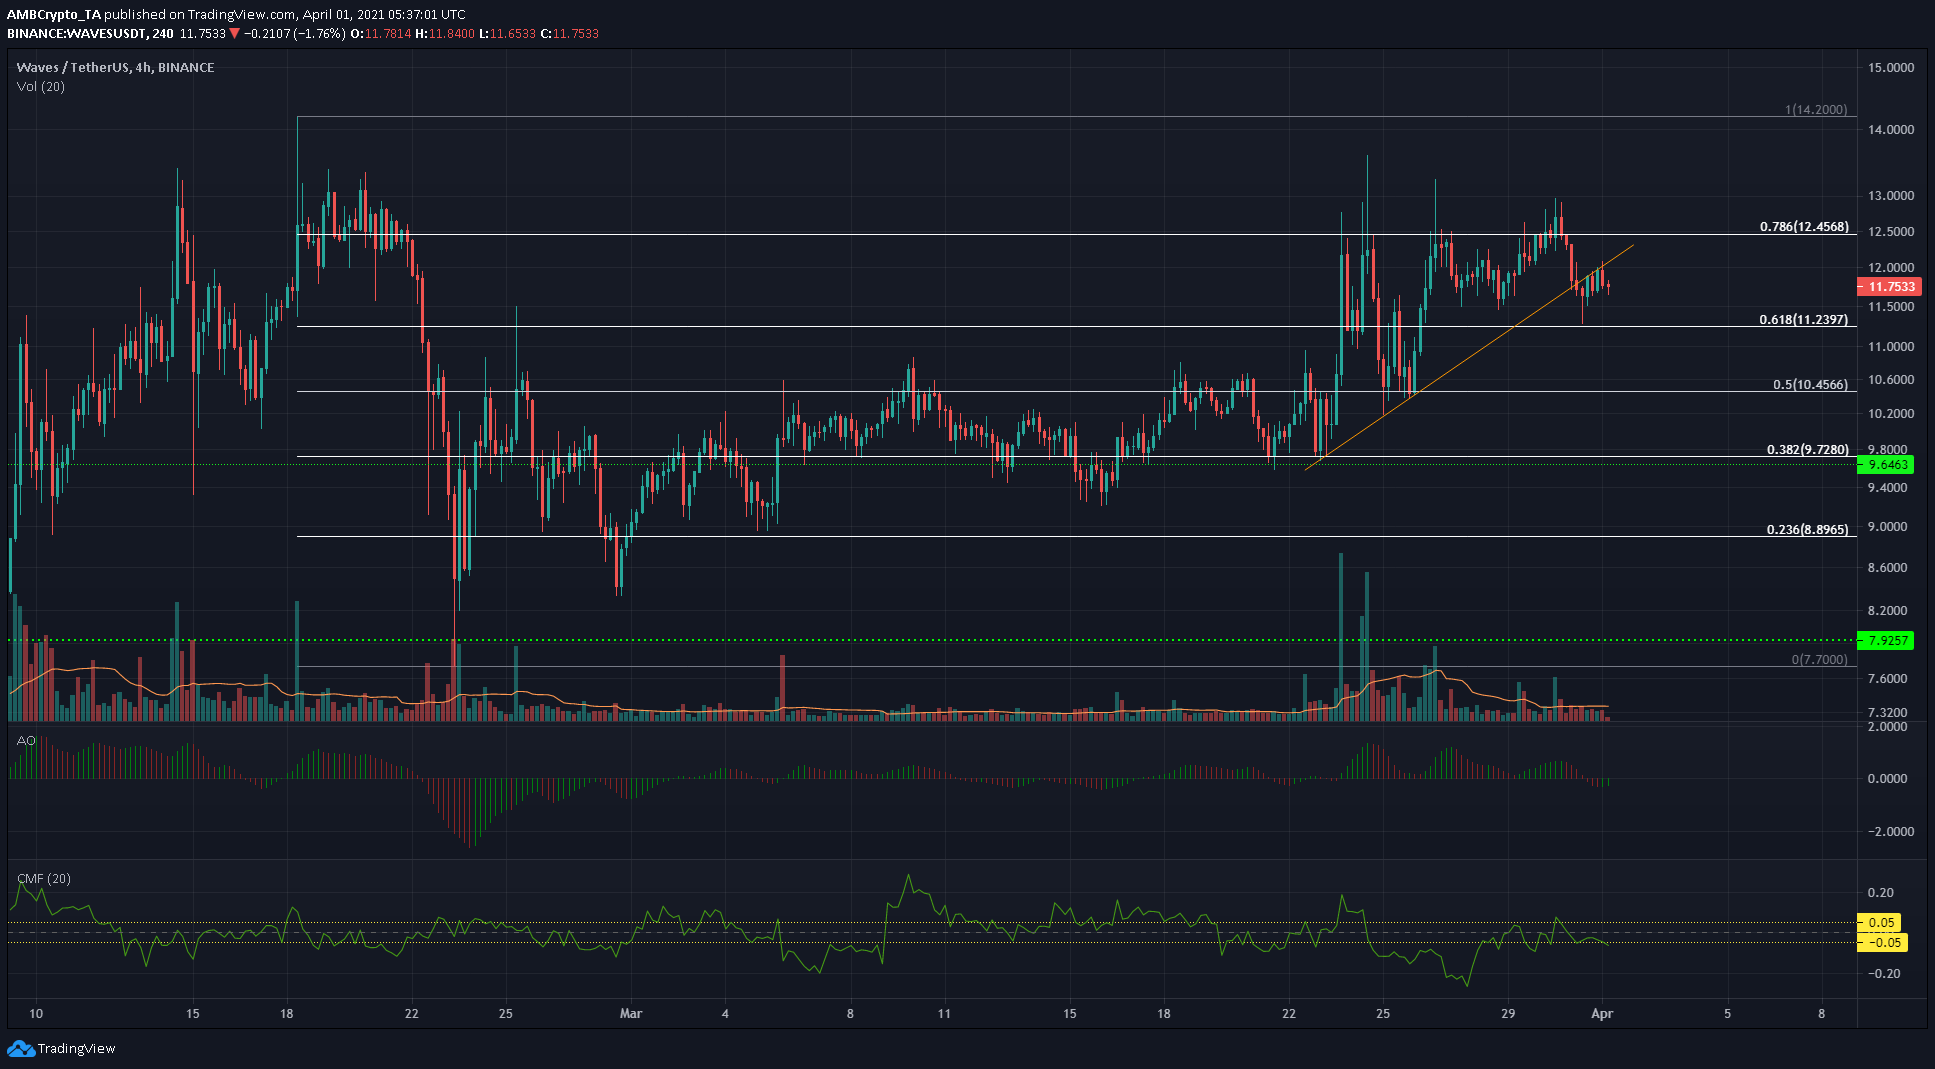
On the 4-hour chart, WAVES slipped under the ascending trendline support (orange), even as the Chaikin Money Flow indicator threatened to drop under the -0.05 value. This would suggest net capital flows out of the market, showing seller dominance.
The plotted Fibonacci retracement levels (white) should serve as support, but short-term momentum appeared to have swung in bearish favor. The Awesome Oscillator dropped under the zero line. A retest of $10.45, the previous accumulation highs, could be seen. In that scenario, it would be a good entry to a long position targeting a move back to $12.45.
Dogecoin [DOGE]
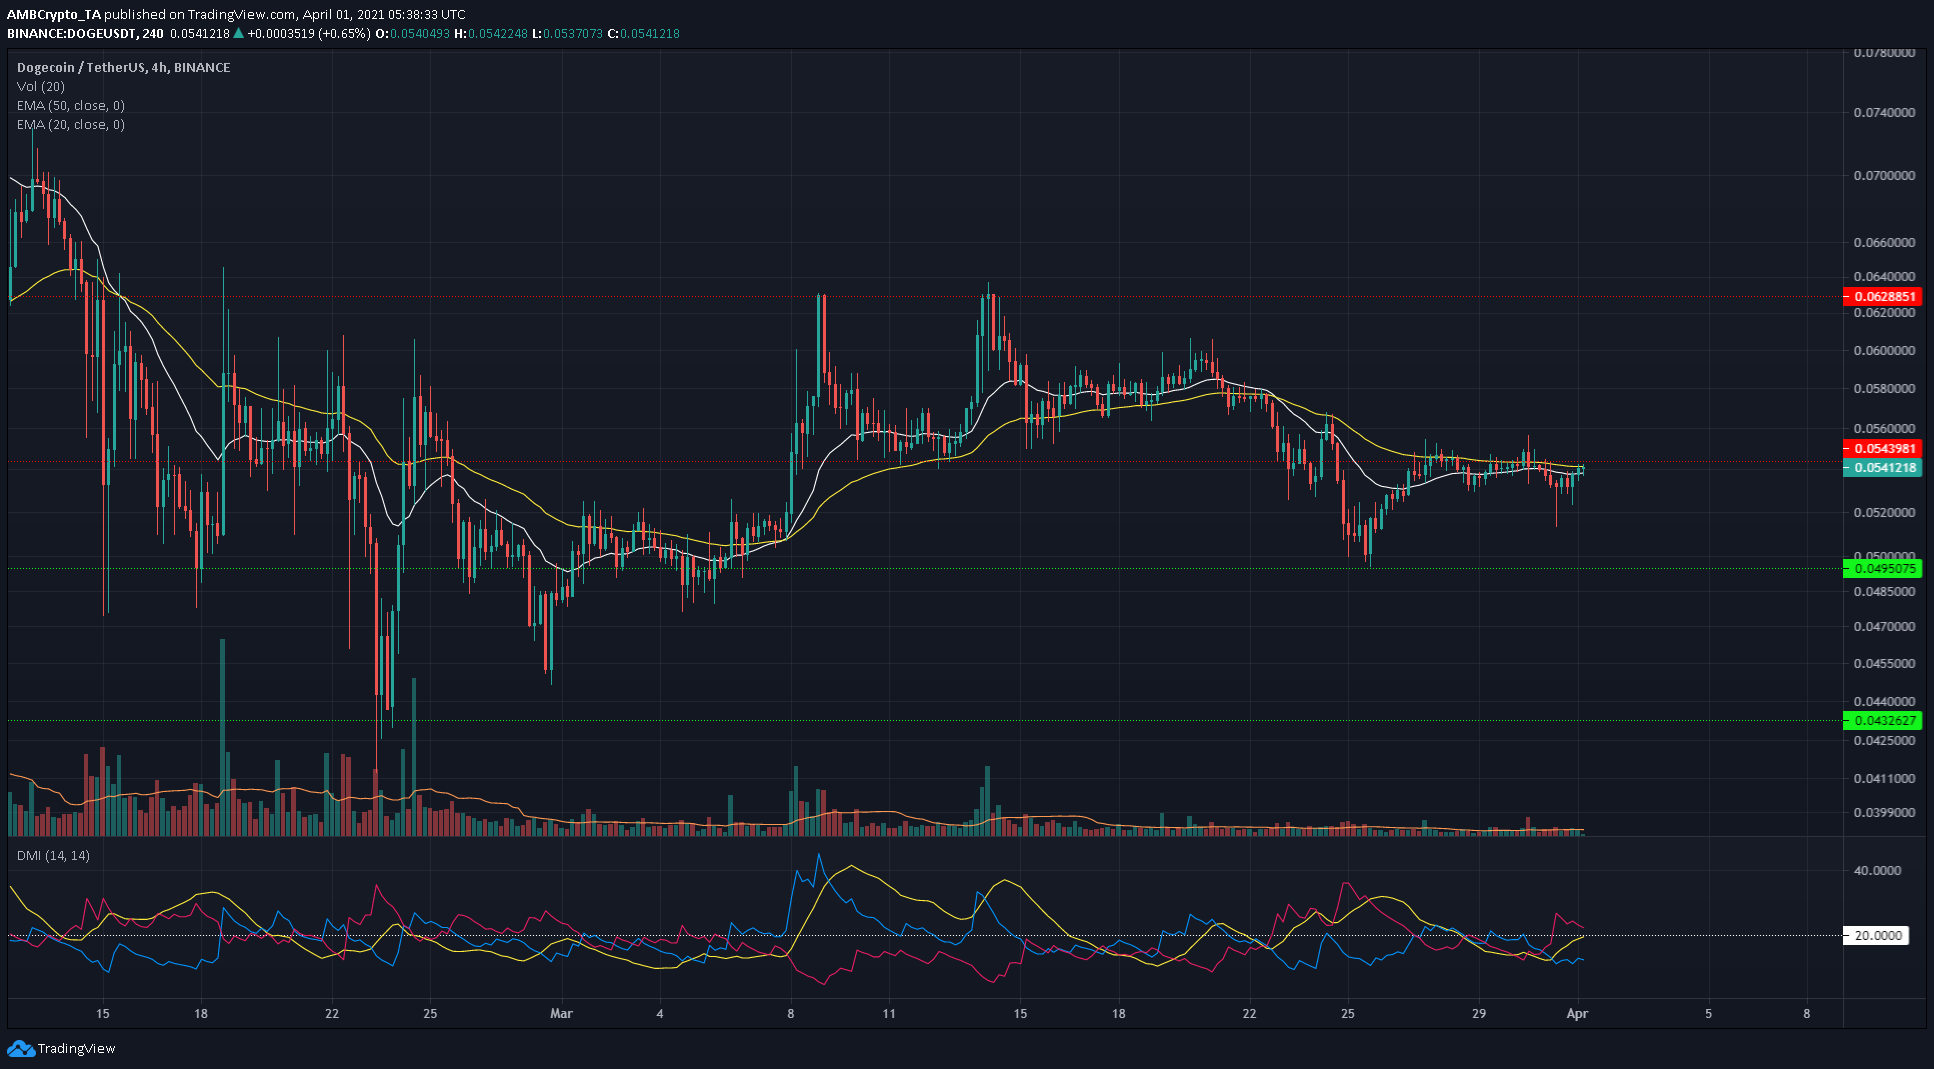
Dogecoin did not have significant trading volume in the recent past. The 20-period EMA (white) was moving under the 50 EMA (yellow) to show that momentum has favored the bears recently.
The Directional Movement Index showed the ADX (yellow) on the verge of rising above 20, with the -DI above 20 as well. This ascent would confirm a strong bearish trend in progress and a move to $0.049 would become more likely.