Bitcoin to $65k, yes, but should traders look out for something

A quick Bitcoin bull run sent the top coin up by 25.60% in a week, initiating a market-wide euphoria. One week into the last quarter of 2021 and BTC was already trading close to $55K, briefly oscillating above the level on 6 October, 2021. With Bitcoin dominance on the rise for the past couple of days alongside solid price gains, the top coin’s move had further strengthened its position in the market.
The rally further accelerated with Soros Fund Management, led by the famed investor George Soros, confirming that it was trading the top coin. Seemingly, with Bitcoin’s price and popularity growing, institutional opponents of cryptocurrencies have slowly been warming up to the digital asset.
However, over the last month, the market has failed to sustain a strong trend for too long, which gave way to considerable skepticism about BTC’s current rally. Nonetheless, there were signs that pointed towards a blasting trajectory for the king coin.
Bullish divergences confirming upward price action
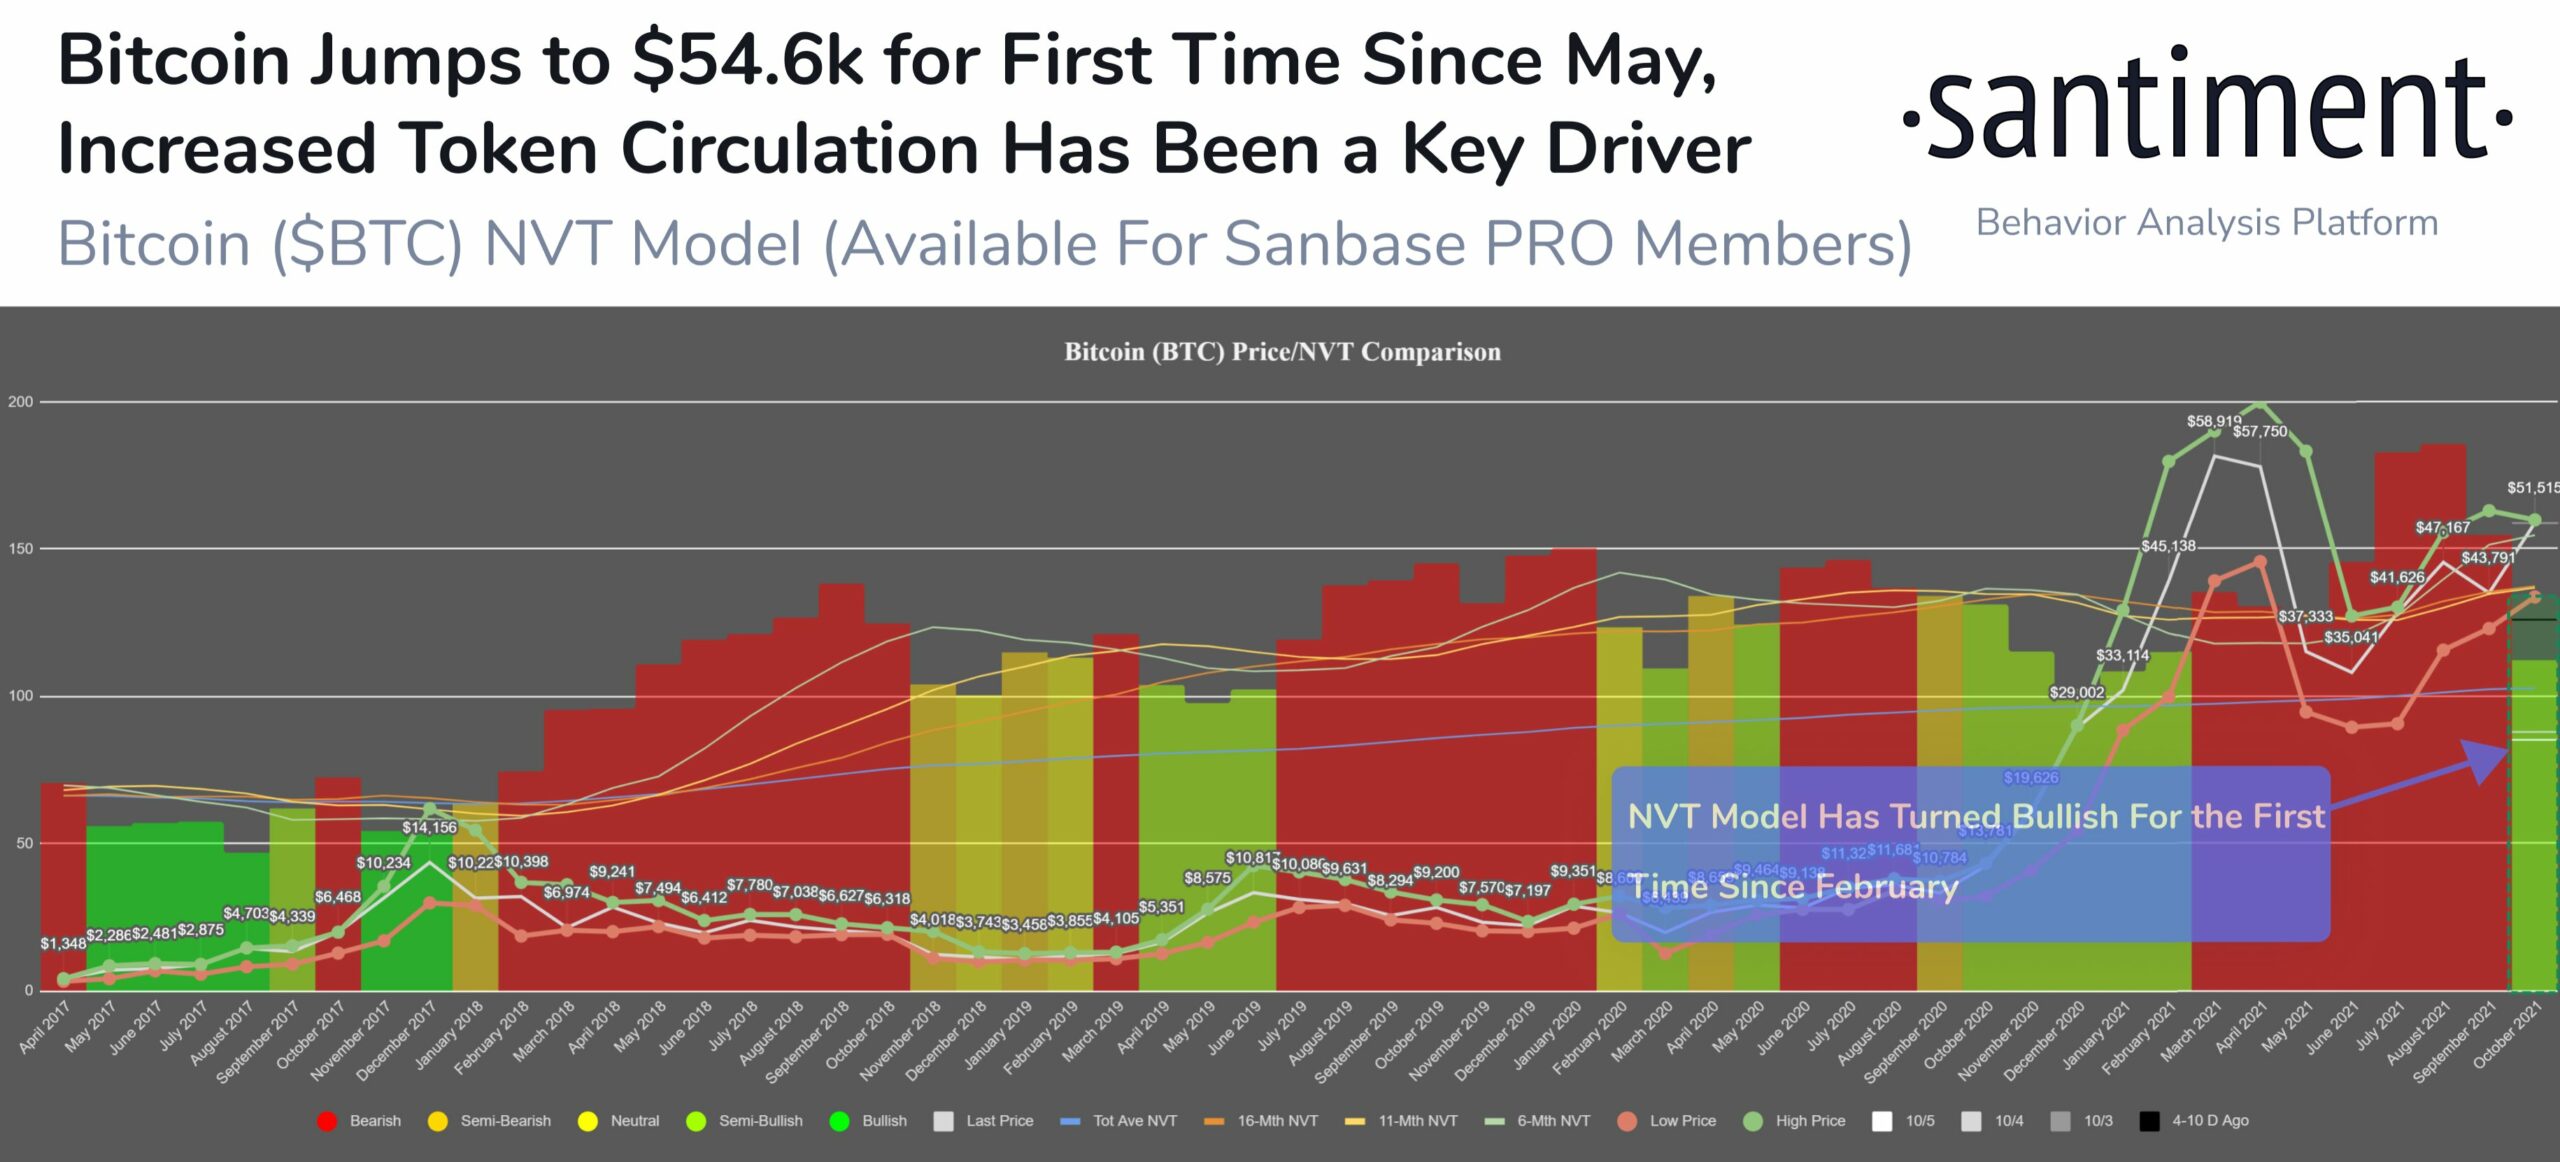
As the crucial $55K mark has been breached for the first time since May 10, Bitcoin’s NVT Token Circulation model indicated that October is the first month where the metric saw a bullish divergence since February this year. This represented a large, positive upward movement in price.

NVT Token Circulation | Source: Sanbase
Further, data from IntoTheBlock noted that as Bitcoin surpassed the $52,000 barrier for the first time since 7 September, IOMAP revealed a strong support right below $50K. At this range, over 353.78K addresses had previously bought 212,000 BTC.
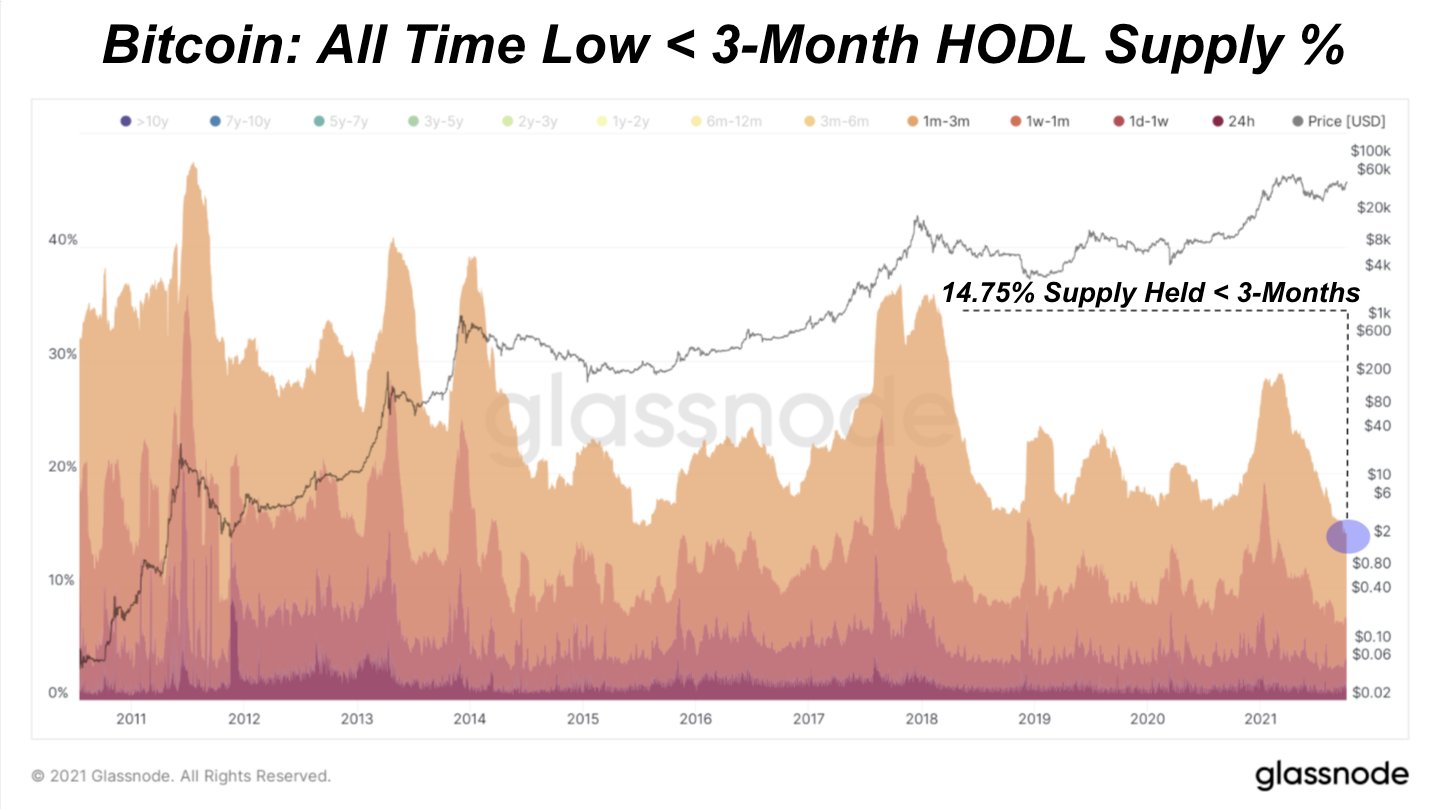
Additionally, for the first time, Bitcoin Network has this large of a percentage of the circulating supply (around 85.25%) been held for over three months. Notably, BTC’s three-month HODL supply percentage was at an all-time low of 14.75% on 6 October, which was also indicative of a supply squeeze in making.

Bitcoin three-month HODL supply percentage | Source: Dylan LeClair
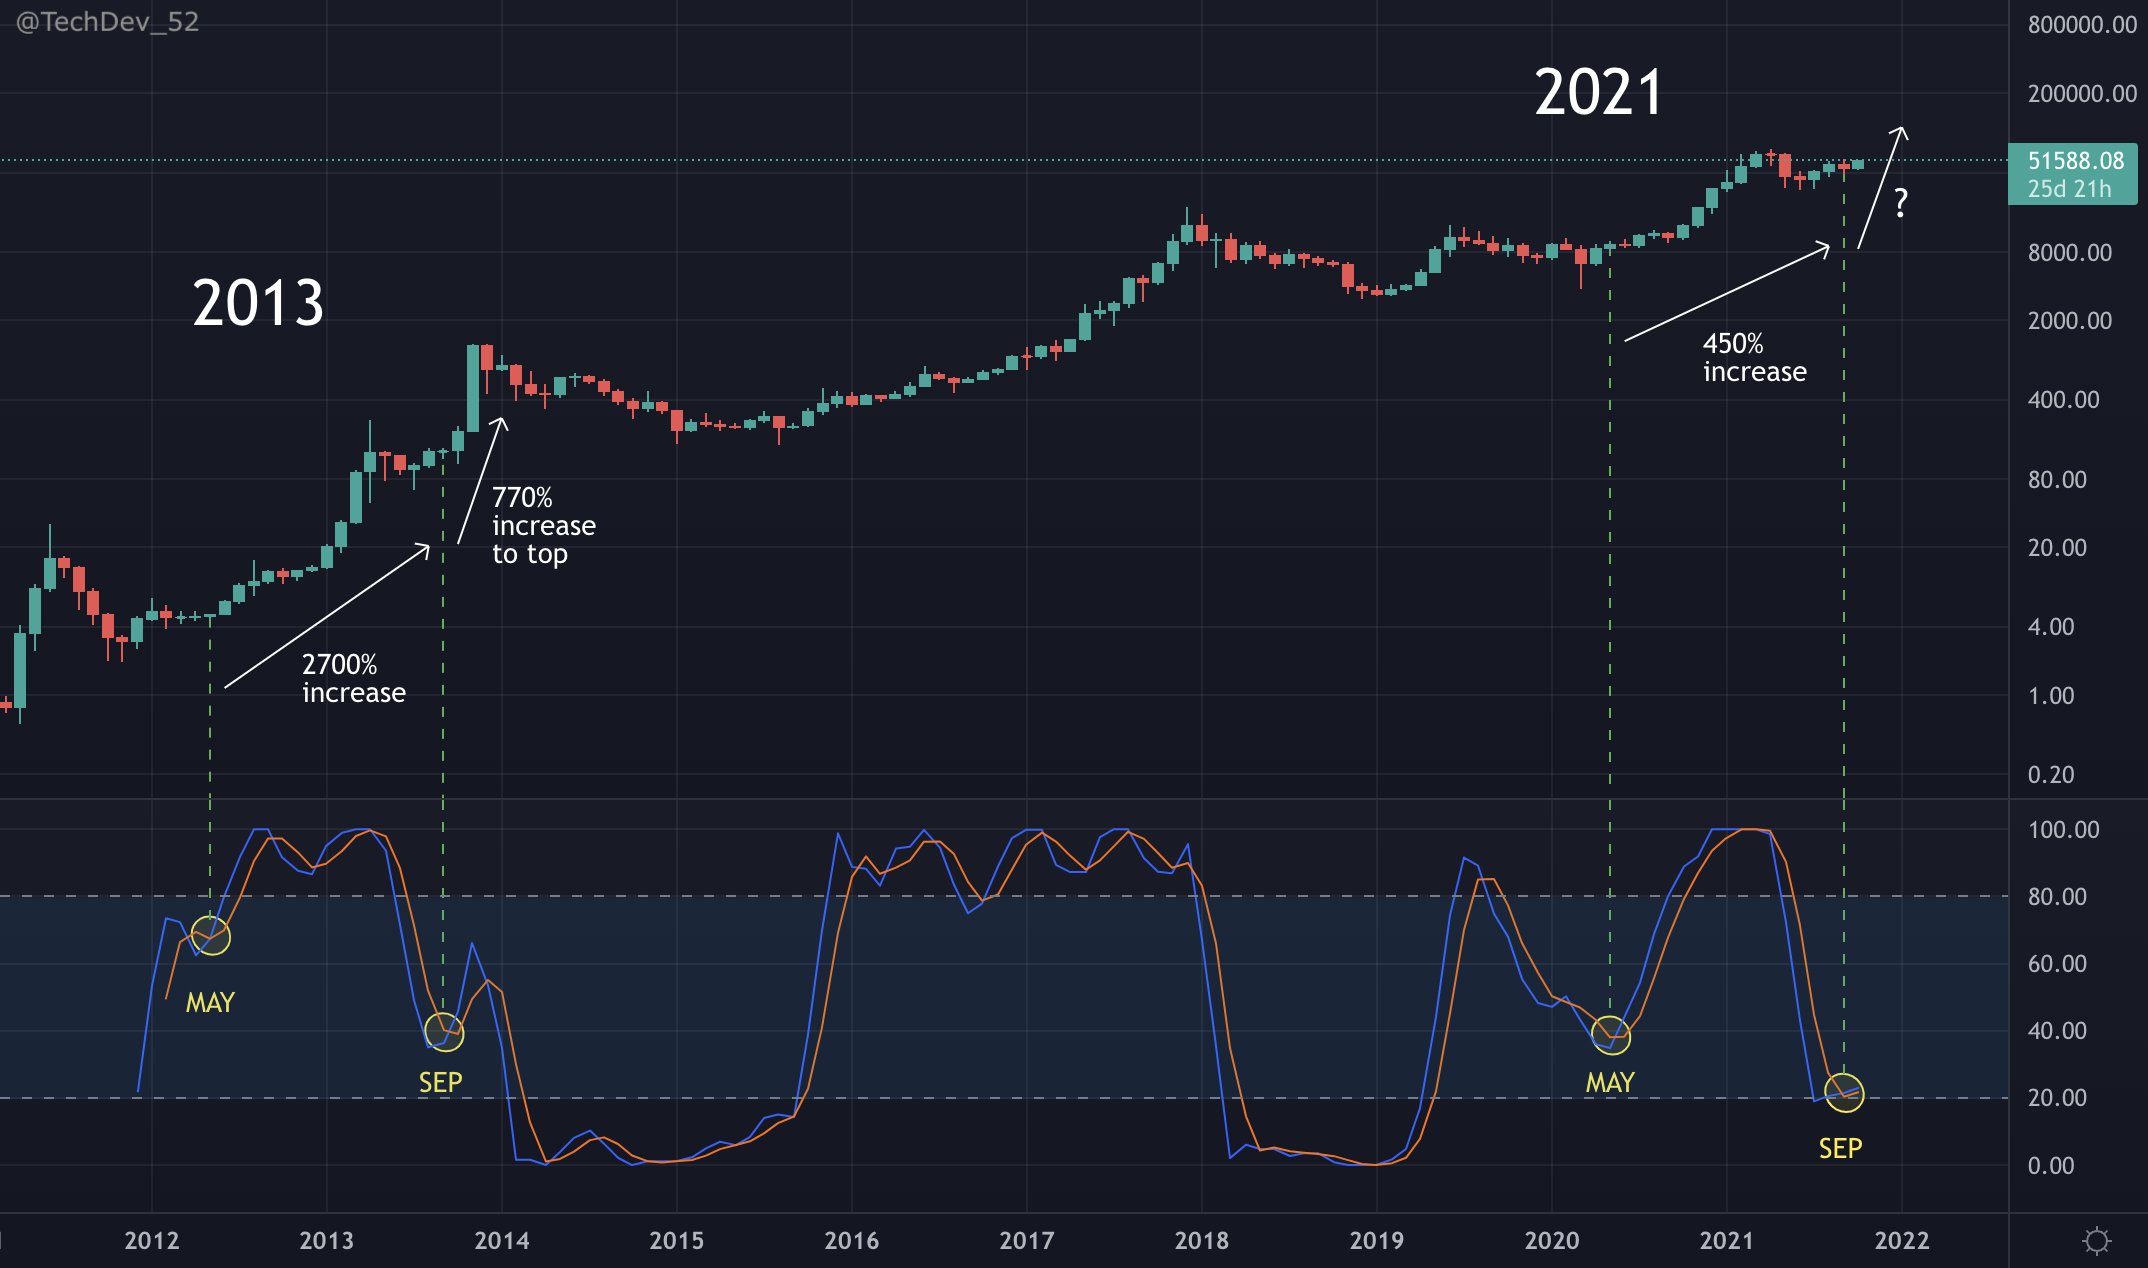
A long-term bullish trend for the top coin was that was coins kept flowing out of the exchanges over the last month which made the liquid supply tight. On the price front, Bitcoin had its 2nd bullish monthly stochastic RSI crossover between 20 and 80 this cycle.
This was an especially bullish cross that only happened two other times over the past- one in September 2013 and another in May 2012. In 2013 it pumped BTC’s price by 2700% while in 2012 the cross pumped the price by 770%.
Warning signs still around
While Bitcoin’s price action looked rather bullish in October, an interesting trend to note was that funding rates had started to turn overly positive suggesting that the market is expecting further upside. This could cause mass unwinding of positions and initiate a downward move if the former begins.
Additionally, the classic euphoria setup has sent investors in extreme greed towards BTC. Thus, it won’t be surprising if BTC sees a small correction and a re-test of $50K as support. The pseudonymous analyst TXMC also noted the same and presented that consolidation may play out over several days if BTC falls close to $50K. Looks like while Bitcoin’s path to a new ATH is set, some consolidation could come as a speed breaker on the way.


![Bonk Coin [BONK]](https://ambcrypto.com/wp-content/uploads/2025/06/Gladys-19-1-400x240.webp)


