May ends in red; what next Bitcoin traders?
Bitcoin retraces to a key dynamic support level as a trendline resistance and $28k becomes a double obstacle for bulls.

Disclaimer: The information presented does not constitute financial, investment, trading, or other types of advice and is solely the writer’s opinion.
The U.S. overwhelmingly passed the recent debt ceiling deal, giving markets a breather. But Bitcoin’s [BTC] bearish sentiment persists after failing to flip bullish on the higher timeframe chart. It closed May in red, sustaining about 4% loss in monthly performance.
Despite the price pump seen last weekend, BTC recorded $11 million outflows in short-Bitcoin in the same period. The trend marks the sixth consecutive outflow totaling over $270 million, according to Coinshares’ Digital Asset Fund Flows Weekly report.
While this underscores the prevailing negative sentiment, declining volumes were also worrying.
BTC’s trendline resistance roadblock
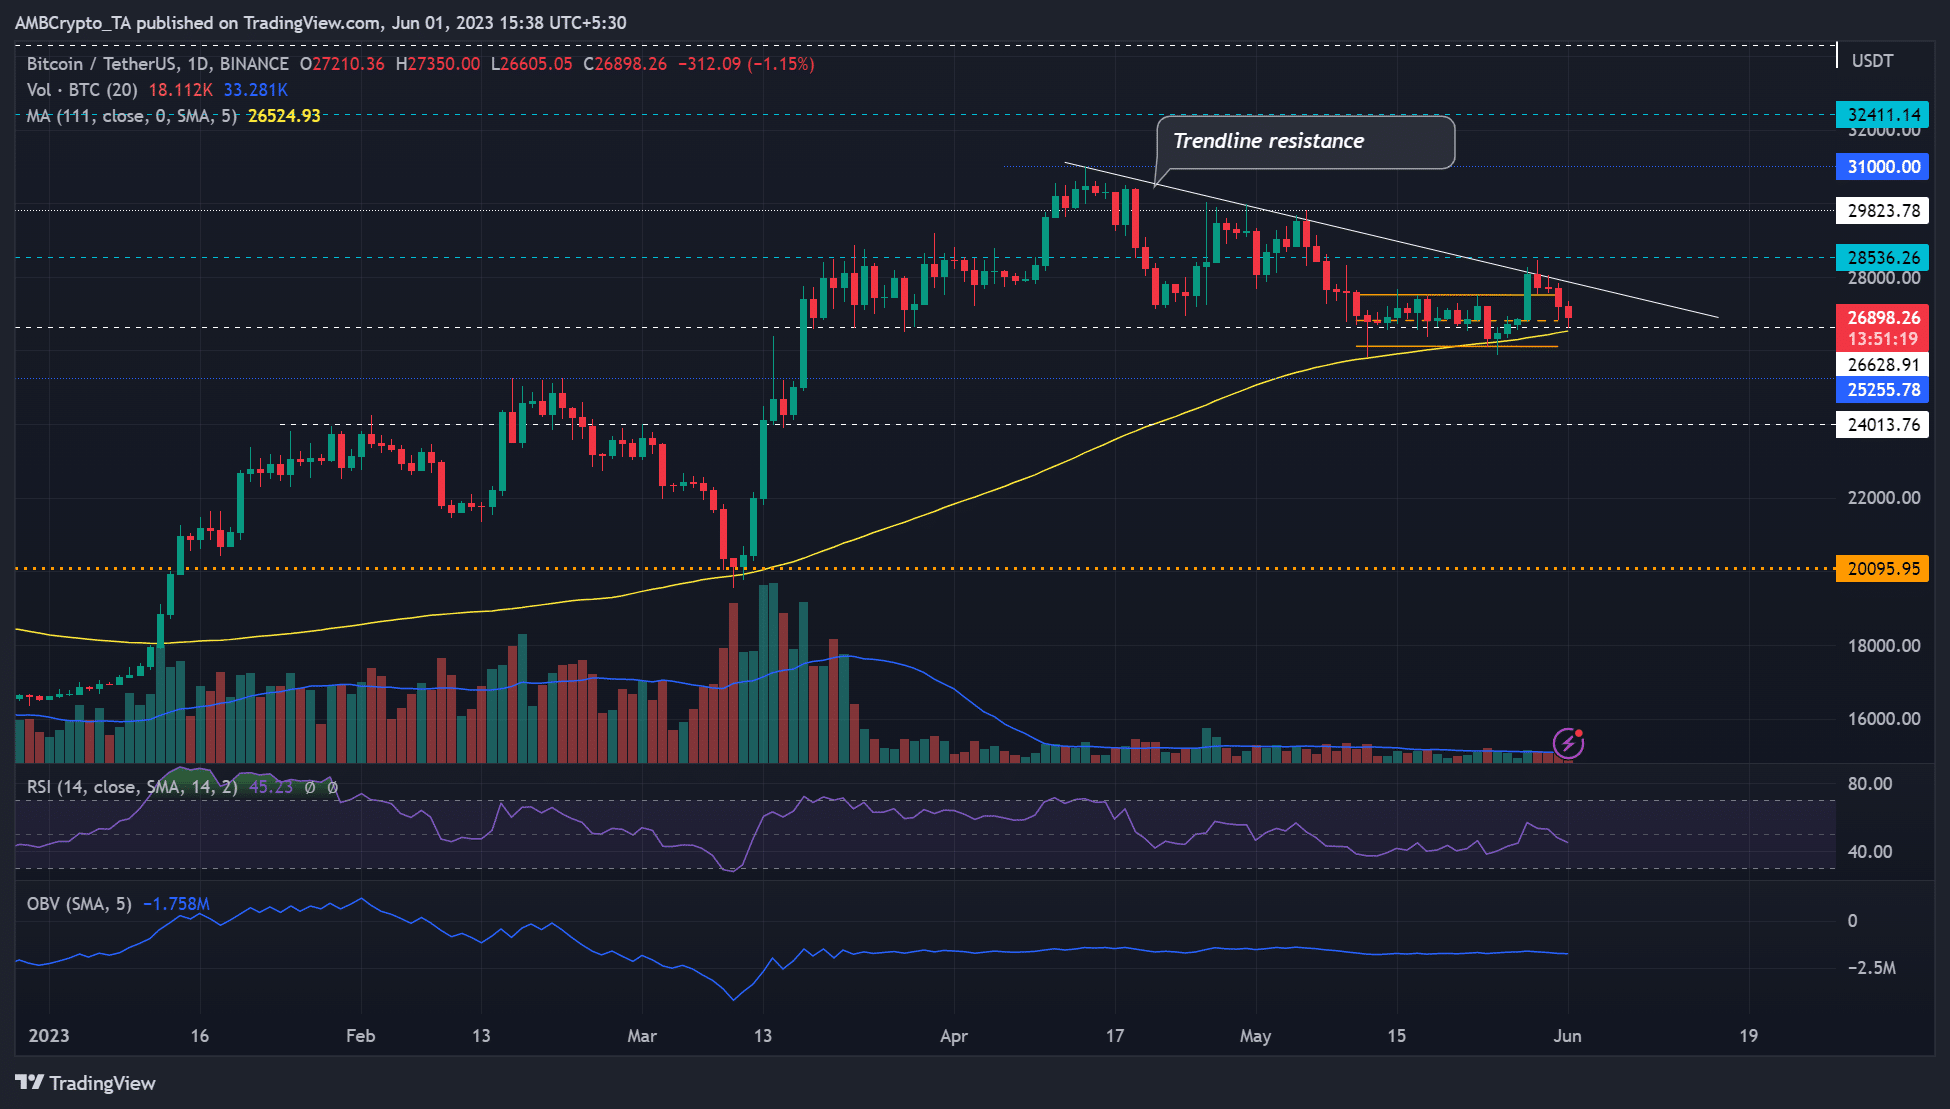
BTC price action has been making lower highs after price rejection at $31k in mid-April. A trendline resistance (white) has become a key roadblock on the daily chart, preventing BTC from flipping to bullish.
A recent bullish breakout on 28 May faced rejection at the trendline resistance, setting BTC to retrace to the previous mid-range of $26.8k. Below the mid-range lies the 111-day MA (Moving Average) of $26.5k.
The 111-MA has checked three major drops so far. One in mid-March and two in May, making it a key dynamic support level. A breach below the MA and range low of $26.0k could offer sellers more upper hand, denting the bullish sentiment further.
The two support levels to watch out for in such an extended plunge are $25k and $24k.
Conversely, BTC could rebound at the mid-range, which aligns with $26.6k, a key support level in late March/April after the U.S. debt ceiling news.
However, bulls must clear the trendline resistance roadblock to gain leverage. Northwards, resistance levels lay at $28.5k, $29.8k and $31k.
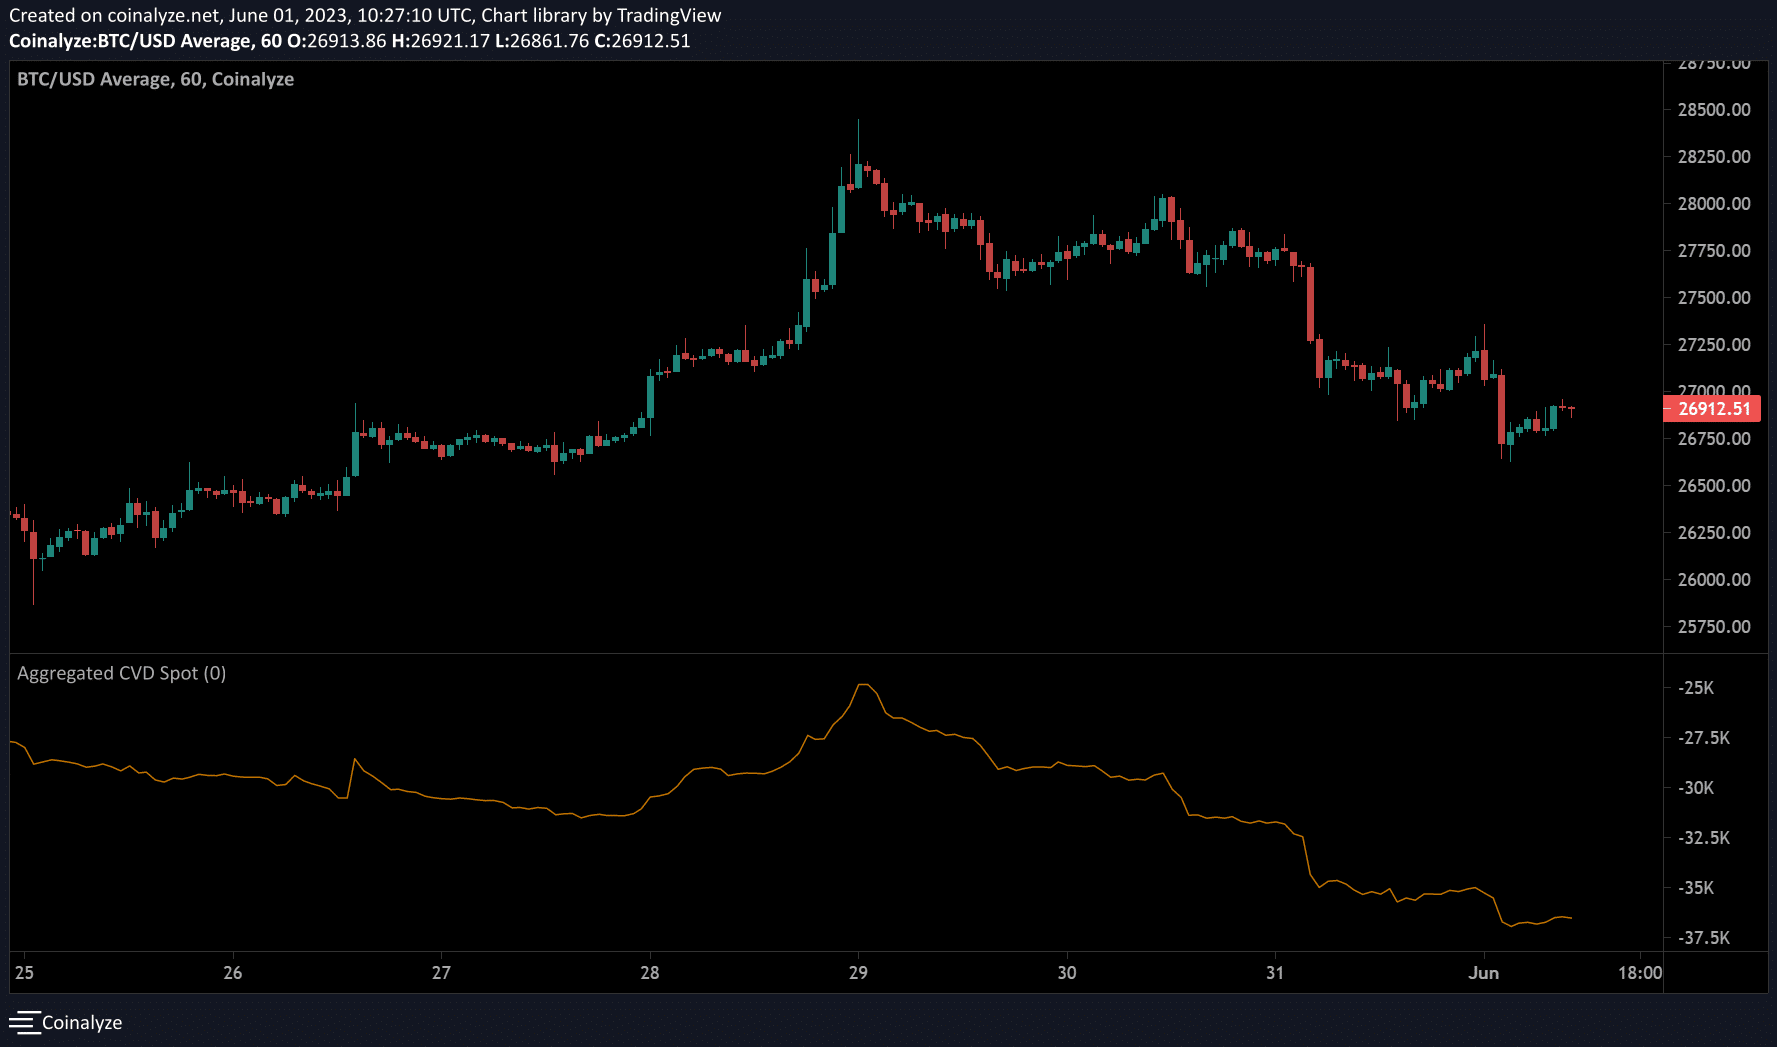
CVD spot declines
Is your portfolio green? Check out the BTC Profit Calculator
Towards the end of May, CVD (Cumulative Volume Delta) spot took a nosedive, declining steadily from 29 May to 1 June (as of press time). It reinforces the sellers’ leverage seen in the past few days.
With the US debt ceiling out of the way, the focus now turns to the FOMC meeting in mid-June. In addition, the $28k level has been marked level by long-term BTC holders in profit and could remain a key obstacle for a while.