Bitcoin v. S&P 500: ‘This seems like an overreaction by speculators if…’

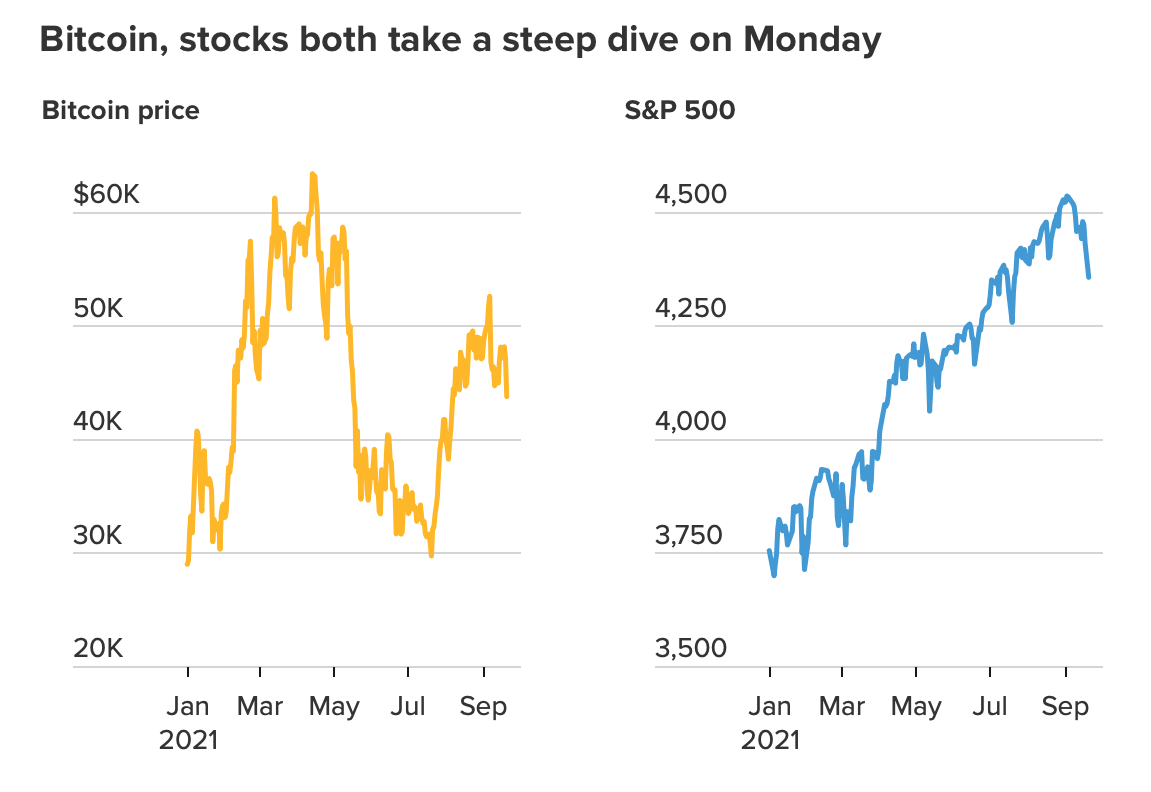
The price of Bitcoin dropped sharply as investors began shedding risk amid a global equity markets decline. One precipitated mainly due to the Evergrande Crisis and regulatory setbacks around the world.
Now, many people have argued that Bitcoin is most useful as a safe-haven asset, compared to the equity market. That being said, corrections weren’t really familiar to just one of these markets.
In fact, according to CNBC, the S&P 500 fell by 1.7% to 4,357.73, posting its worst daily performance since 12 May just 2 days ago.
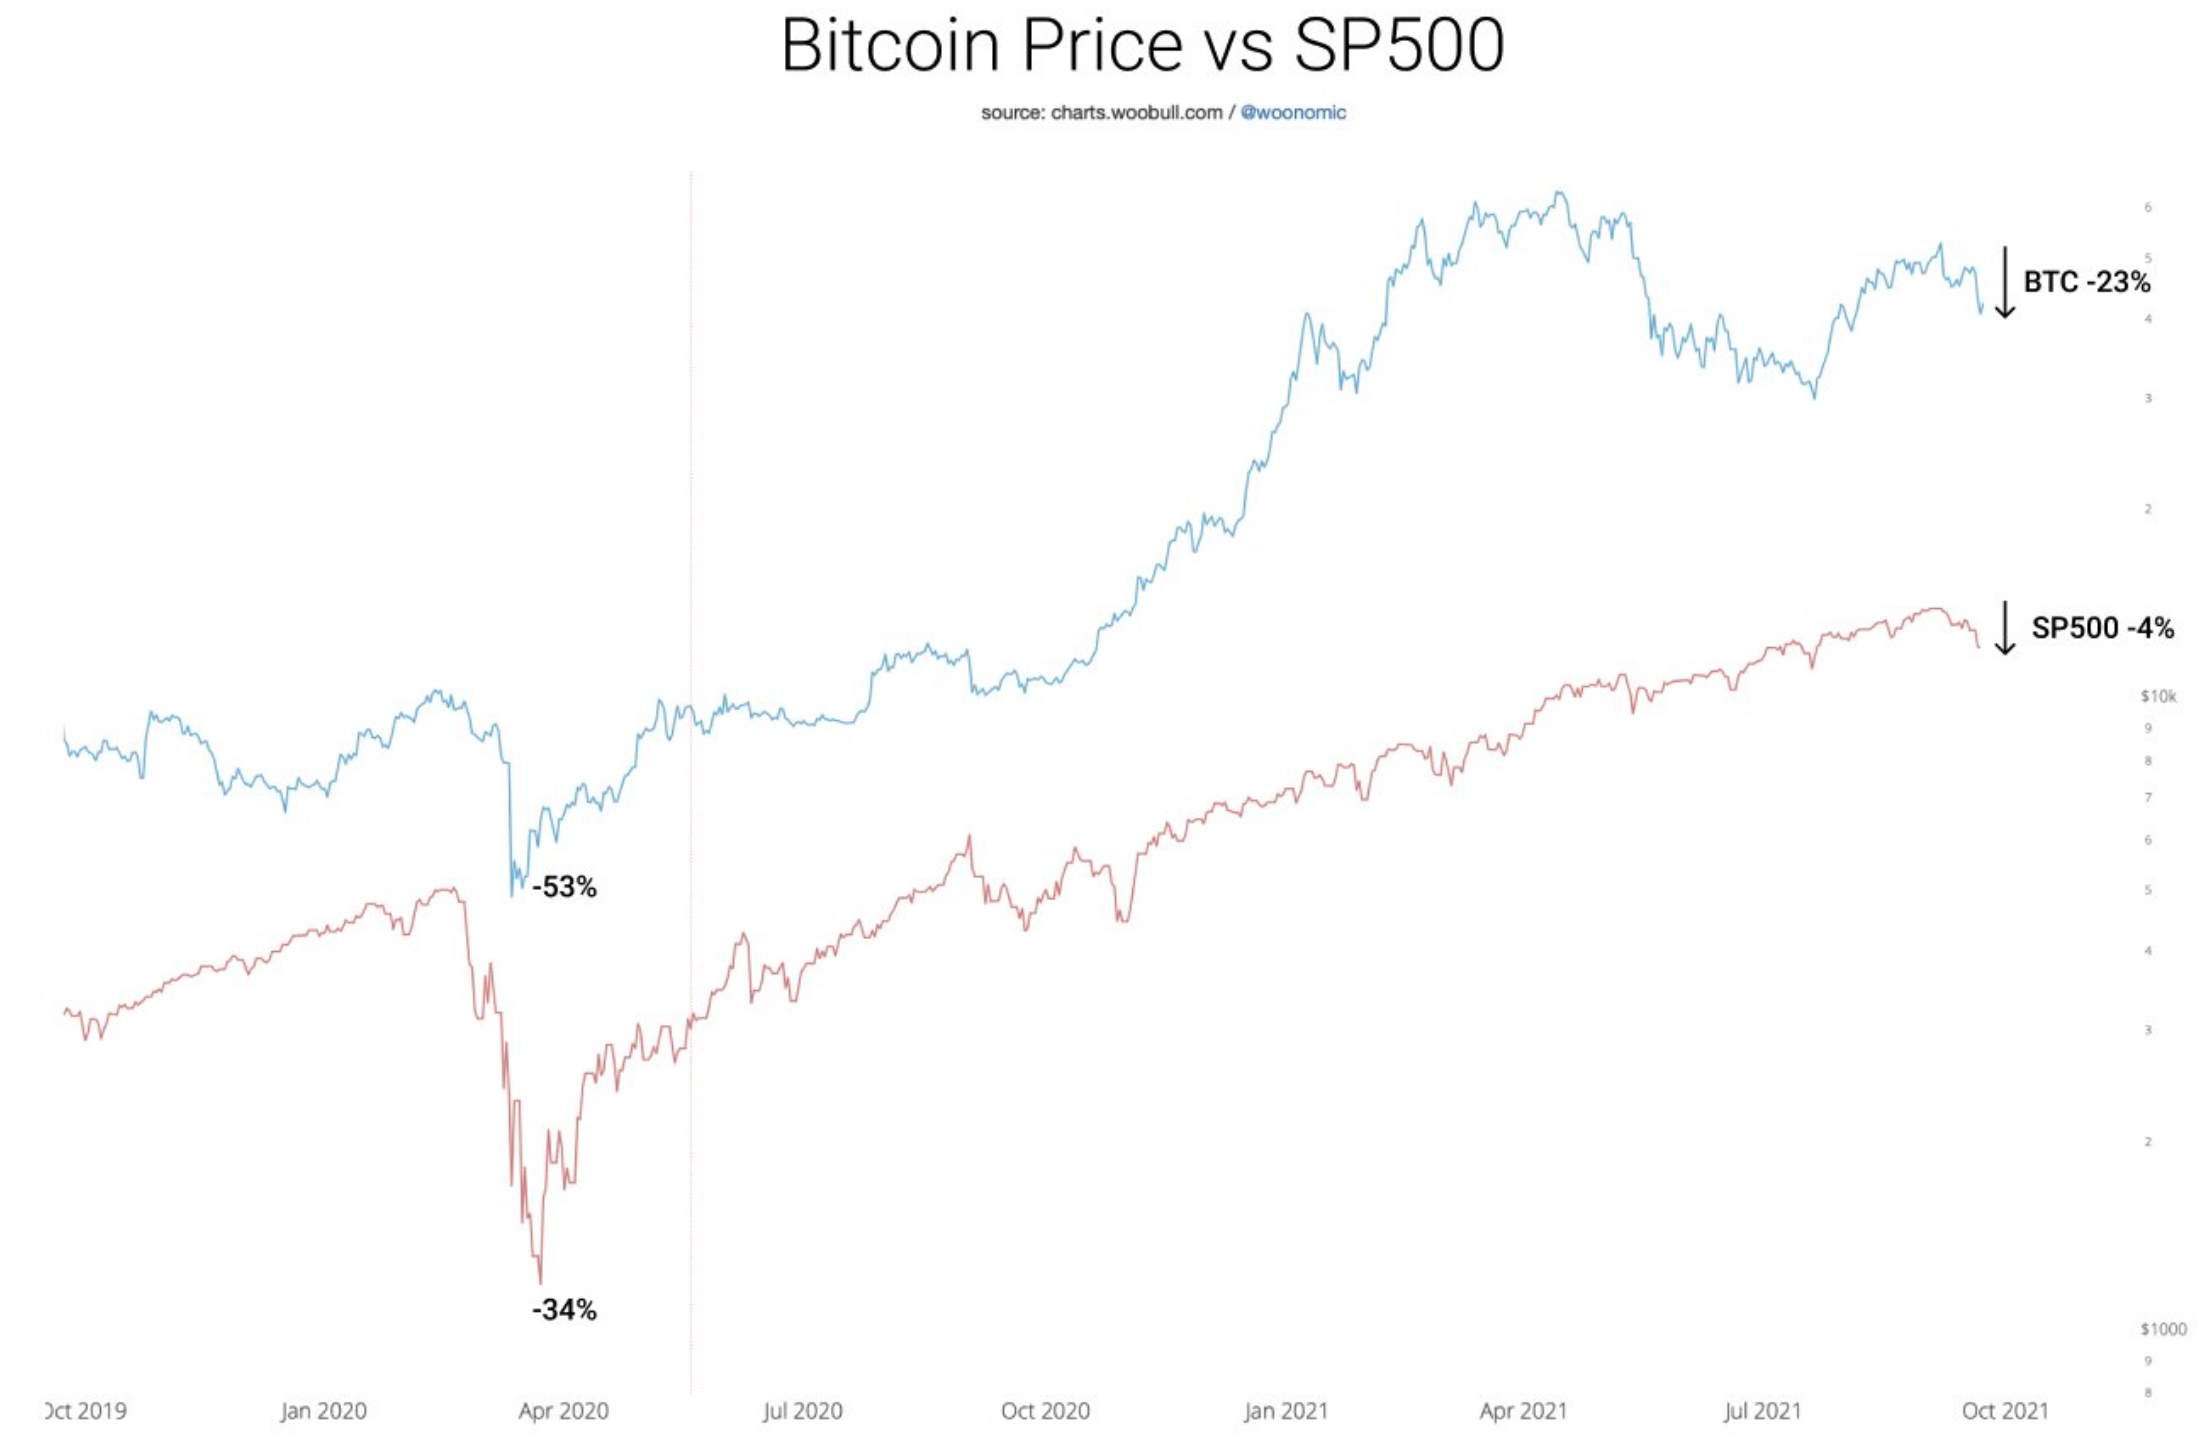
Comparing both of them, popular chartist and on-chain analyst Willy Woo recently took to Twitter to discuss the same in a series of tweets. With reference to the drawdowns noted by both, the analyst claimed,
“Seems like an overreaction by speculators if you ask me.”
Why? Well, the following chart may give us an idea of the same.
Meanwhile, long-term investors remain undeterred in their quest to HODL their holdings. Some are even buying more. Woo tweeted,
“Since long-term investors aren’t batting an eyelid, they keep on buying like nothing has happened. Sooner or later there will be a supply squeeze to the upside.”
In addition to this, he further presented his vote of confidence for the world’s largest crypto-token. Like many others, Woo remains bullish since,
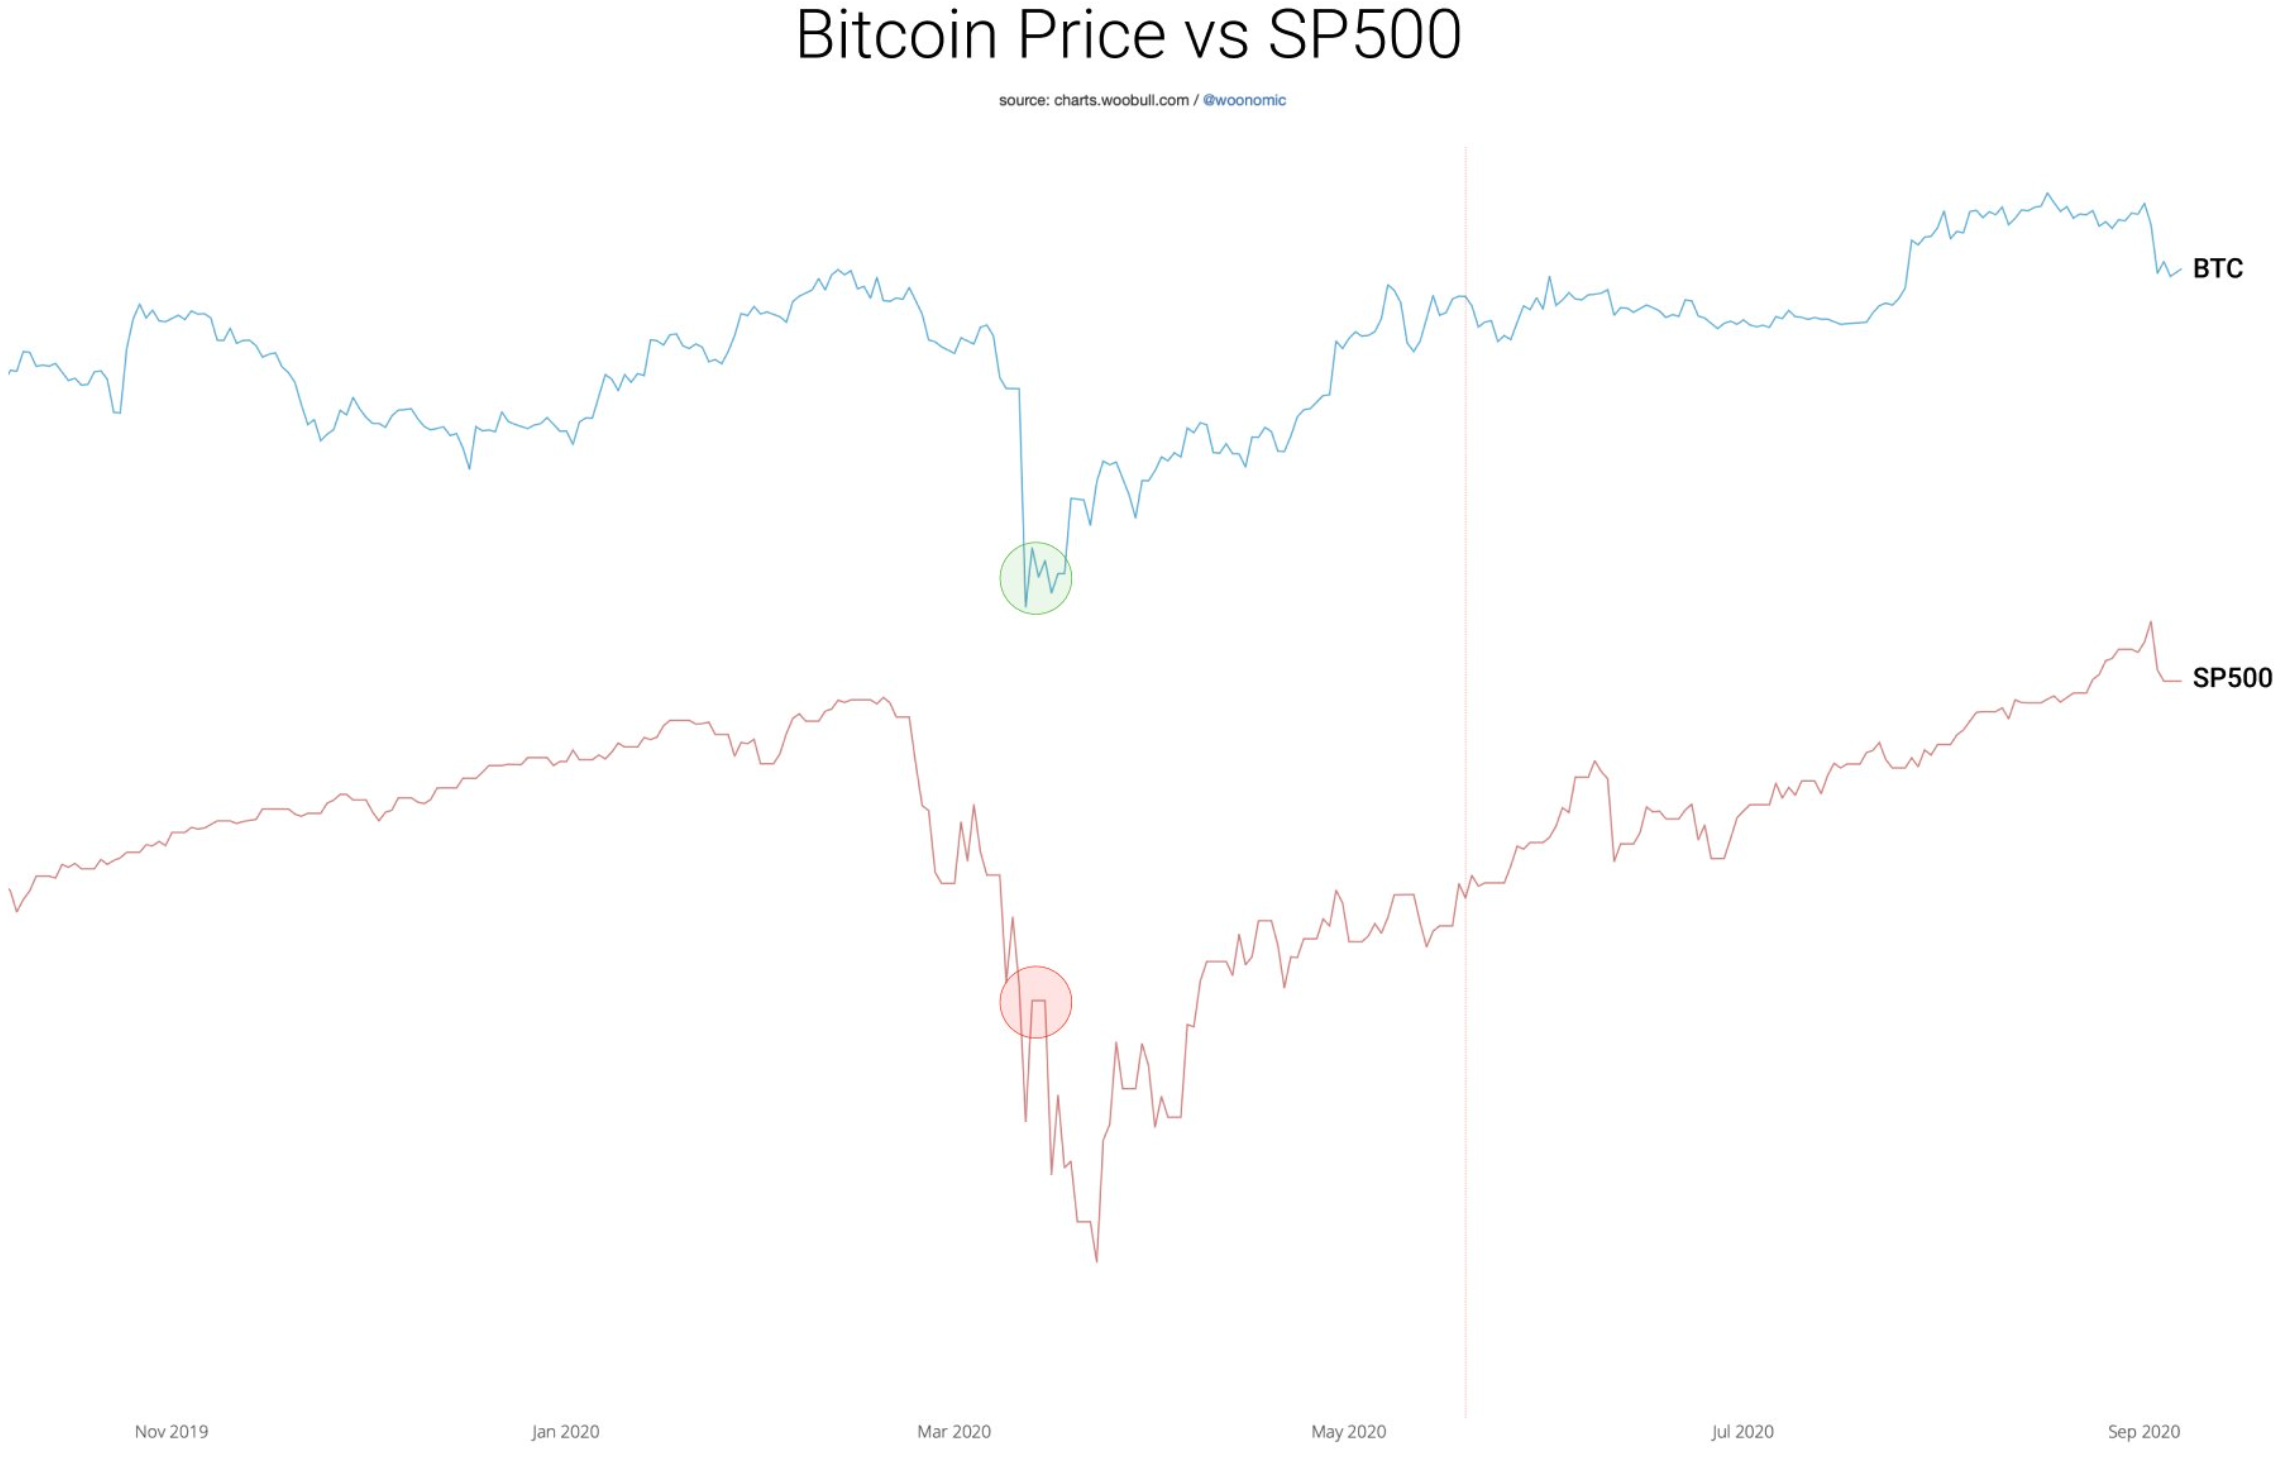
“Even if equities sell-off, BTC proved that it acts as a safe-haven in the COVID white swan event. After the short term BTC investors sold off in a flight to safety, long term investors piled on with buys, even as equities tanked further. This time investors aren’t even selling.”
The analyst went on to substantiate his point by sharing the following chart as well.
Nevertheless, not everyone agrees with Woo on the subject in question. For instance, one of his followers was quick to point out that,
Wut?
"Even if equities sell-off, BTC proved that it acts as a safe-haven in the COVID white swan event."
BTC … nuked a lot harder lol pic.twitter.com/Sphq6pC2yZ
— dart (@poordart) September 22, 2021
Real-time significance
Bitcoin fell below $40,000 a few days ago for the first time in six weeks. Now, although, it is still outperforming the S&P 500, Gold, and other indices, it’s worth considering the attached chart for some more perspective.
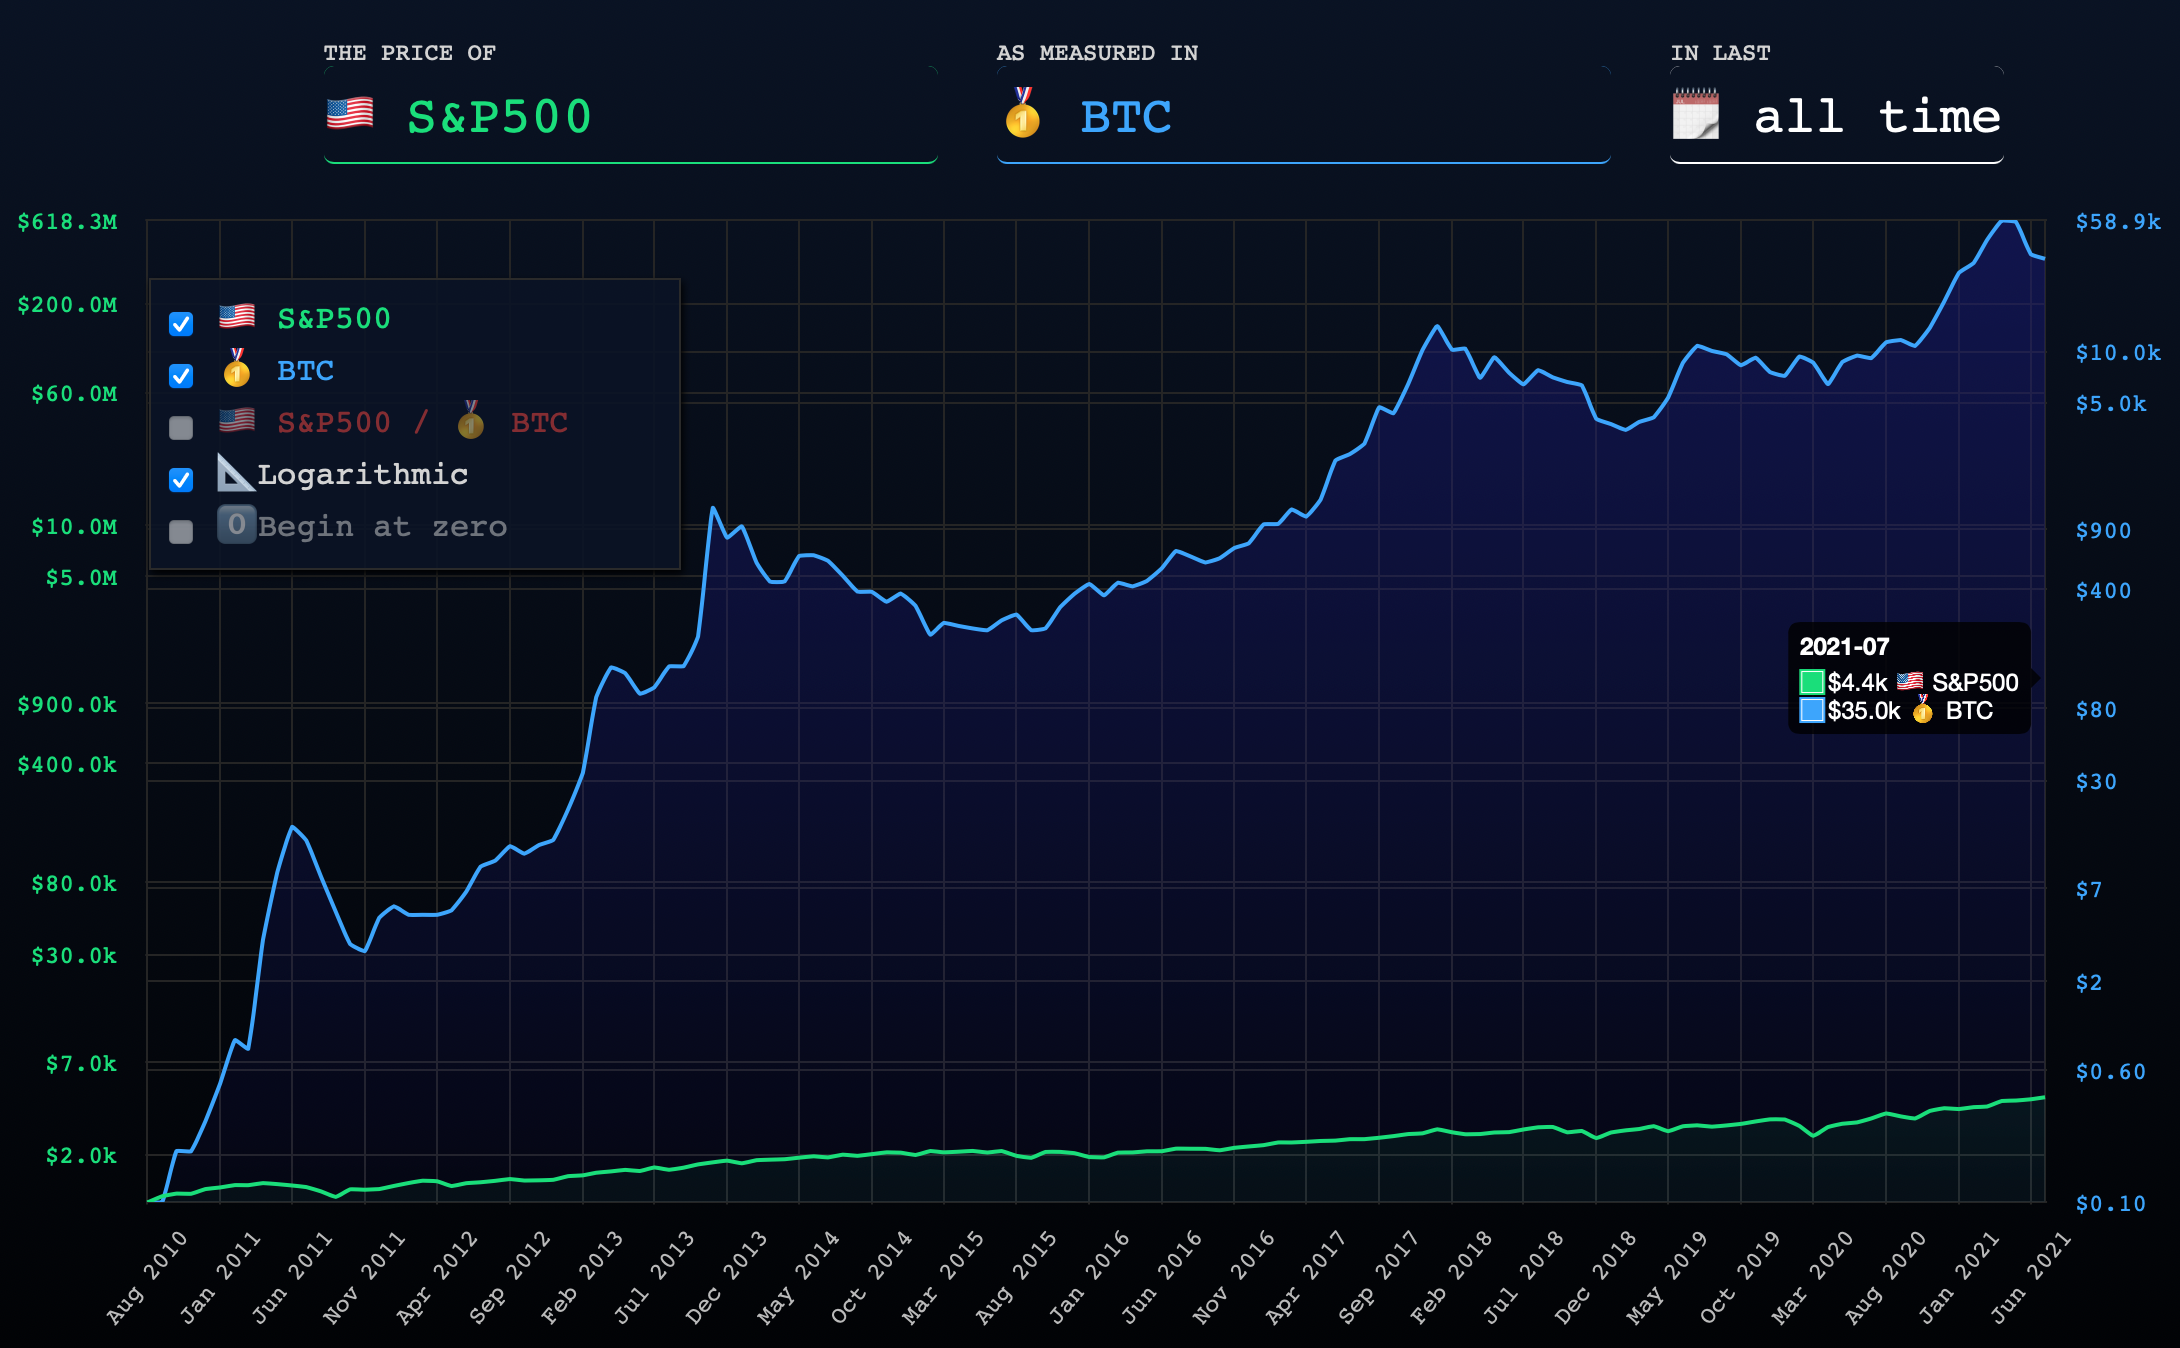
Along similar lines, a recent Ecoinometrics tweet was also quick to point out Gold, S&P500, and crude oil prices in Bitcoin (as of 20 September).
Priced in #Bitcoin
Sep. 20, 2021🟡 Gold: 0.041 BTC per ounce
🔵 SP500: 0.100 BTC
⚫️ Crude Oil: 162k sats per barrel pic.twitter.com/my6JcyfD4G— ecoinometrics (@ecoinometrics) September 21, 2021
Having said that, it’s not worth ignoring that Bitcoin too has suffered at the hands of recent economic uncertainty. Its percentage decline from its peak of about $63,000 in April was around 32%, at press time.
The aforementioned figures were significantly higher than the three percent of the S&P 500. Needless to say, this will only give more fuel to those who claim Bitcoin is more volatile than traditional assets. This, despite its drawdowns occurring simultaneously with the S&P 500′s.


