Bitcoin: What happens when the ‘unlikely’ becomes ‘more likely’

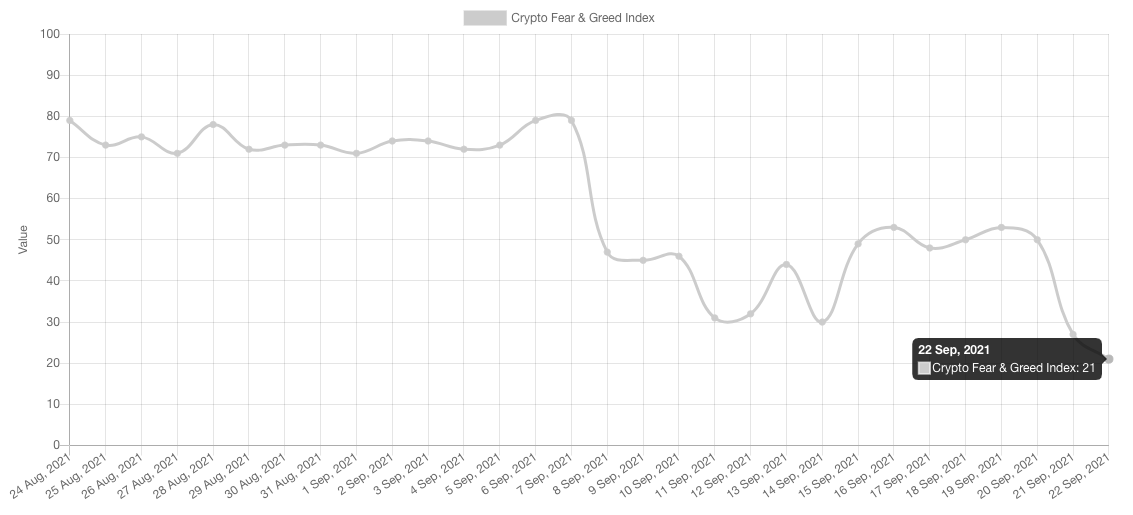
Over the past 3 days, Bitcoin’s price has been making lower lows – first $46.8k, then $42.5k and finally $39.6k. As the king-coin’s price momentarily dunked below $40k, during the late hours of Tuesday, fear spread like wildfire. Consequentially, the F&G index fell to its 1-month lows.
The aforementioned index considers factors including market momentum, volatility, social trends, dominance and trading volume. Higher values usually correspond with greed while lower values highlight the market participants’ terror. At press time, this index explicitly reflected a value of 21 [extreme fear].
Is the fear prevalent in the market valid?
Well, in a volatile environment, the unlikely becomes more likely. Whenever the “market discussed” volatility or implied volatility (IV) goes up, it underlines the fact that participants expect the market to behave in a dramatic fashion in forthcoming trading sessions.
At this point, it should be noted that when the “At The Money Implied Volatility” (ATM IV) slumps, options traders basically wager that the time value premium they collect, would be sufficiently high relative to the risk they’re taking.
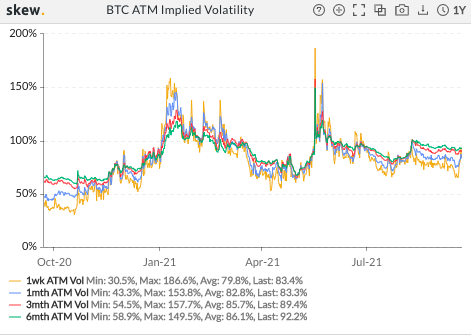
Bitcoin’s price, more often than not, rose whenever the ATM IV fell and vice versa. During January’s downfall, the IV was quite high. Similarly, during April’s rally, the value of this metric was low – to be precise, it was constricted within the 50%-100% bracket. During May’s bloodbath, again, the IV massively spiked.
The chart attached above showed no abnormal spike of late and the ATM IV was currently in the favorable 50%-100% zone. This, by and large, is a positive sign.

Further, Skew levels seemed fairly decent at the time of writing. The 25 delta one is the most common measure of skew. The chart above exhibits the 1W, 1M, 3M, and 6M 25d skew over the past month.
The y-axis, measures the difference between the IV between the 25d call and the 25d put of the same expiry. Positive skew usually suggests that the market wants to pay to own upside payouts relative to downside payouts.
In such situations, natural longs refrain from selling calls on their existing coins and speculators too buy calls to have a leveraged participation to the upside. Now the chart below highlights that price optimism is prevalent amongst the market’s options traders to a fair extent.
Further, the “call buy : put sell” ratio was more than 1 at the time of writing, implying that put traders who were trying to hedge the downside risk did not have much of a say.
Looking at the state of the aforementioned metrics associated with the options market, it can be said that nothing much has changed structurally for Bitcoin. It is still in a pretty good position to rally higher in the foreseeable future. Consequentially, when that happens, fear would gradually fade away from the broader market.


